Convective cold pool structure from BAMEX dropwindsonde and surface analysis
10 likes | 150 Vues
Introduction.

Convective cold pool structure from BAMEX dropwindsonde and surface analysis
E N D
Presentation Transcript
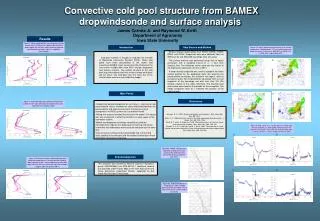
Introduction Cold pool evolution is thought to modulate the strength of Mesoscale Convective Systems (MCS). These cold pools have been documented in the recent field experiment BAMEX. Here, we examine the structure of the non-severe multiple bow echo MCS through dropsonde and surface analysis. The vertical structure of the cold pool may have determined why severe surface wind gusts did not occur. The cold pool near the wake low of the northern bow echo was less stable but deeper. Data Source and Method Surface airways observations from ASOS, AWOS, CAWS, RWIS, and SCAN. Dropsonde data were obtained from the WMI Lear jet and MGLASS soundings were also used. The surface analysis was performed using time to space conversion with a sampling interval of +/- 1 hour from analysis time. The advection vector used was the motion of the leading line convection (20 m/s at 290). A height based composite was used to compute the mean vertical profiles for the dropsonde data. We examine the preconvective soundings, the stratiform rain region, and the convective wake. We composited the soundings from a visual inspection of the soundings and also from their 700 hPa location relative to the radar reflectivity. The freezing level and surface were used as the bounds for the composite. The height composite value of 1 indicates the position of the freezing level. Acknowledgments This research was funded by National Science Foundation grants ATM-9909650 and ATM-9911417. Additional funding was provided under Project 3803 of the Iowa Agriculture and Home Economics Experiment Station, supported by the Hatch Act and state of Iowa funds. References Main Points Johnson, R. H.: 2001: Surface mesohighs and mesolows. Bull. Amer. Met. Soc., 82, 13-31. Betts, A. K., 1985:Mixing line analysis of clouds and cloudy boundary layers. J. Atmos. Sci., 42, 2751-2763. Smull, B. F. and J. A. Augustine, 1993: Multiscale analysis of a mature meso-scale convective complex. Mon. Wea. Rev., 121, 103-132. Stumpf, G. J., R. H. Johnson, and B. F. Smull, 1991: The wake low in a mid-latitude mesoscale convective system having complex convective organization. Mon. Wea. Rev., 119, 134-158. • Subjectively derived composites do not show es returning to near preconvective values. However the close relationship between the preconvective and wake environments may be one way to incorporate a full MCS system into a numerical model. • Mixing line analysis revealed that mixing in the lowest 700 meters was was not present in either the stratiform or wake region of the convective system. • Mobile and dropsonde soundings revealed two different thermodynamic regimes of a deep layer of warming and drying (wake low) and subsidence warming at the cold pool top (no wake low). • Lack of severe surface winds was probably tied to the strong static stability of the cold pool and the implied shallow layer where downdrafts would have originated. Convective cold pool structure from BAMEX dropwindsonde and surface analysis James Correia Jr. and Raymond W. Arritt Department of Agronomy Iowa State University Results Figure 1: Wind speed profiles from the preconvective environment, stratiform rain region and convective wake region. On the left is radar reflectivity derived classification and on the right is a subjective classification. Figure 4: Time to space conversion analysis of surface temperature ( dashed every 1oC) and surface pressure (black line every 1 hPa) for a. 0433 UTC, b. 0529 UTC, c. 0703 UTC, and d. 0843 UTC. A. B. C. D. Figure 2: Saturated equivalent potential temperature profiles for the radar derived classification (left) and a subjective classification (right). Figure 5: Time series of a. surface pressure (solid) and rain rate (column), b. wind speed (solid) and rain rate (cloumn) for Chariton, Iowa near the southern bow echo, c. and d. same as a. and b. except for Ankeny, Iowa. B. A. Figure 6a. Mobile sounding from MGLASS at 0703 UTC in the vicinity of the wake low seen behind the decaying northern bow echo. Figure 3: Mixing line analysis depicting Equivalent potential temperature vs. mixing ratio classified by radar reflectivity (left), and a subjective classification (right). Results are very similar but show that mixing is suppressed in the lowest 700 m. C. D. Figure 6b. Dropsonde profile of temperature (solid) and dew point (dashed) from 0832 UTC in the vicinity of the southern most bow echo.