Histogram Processing and spatial filtering
Histogram Processing and spatial filtering. Chapter 3 (cont.). Histogram Processing. Topics Histogram Processing Histogram Equalization Histogram Matching (Specification) Local Histogram Processing. Image Histograms. Basic for numerous spatial domain processing techniques

Histogram Processing and spatial filtering
E N D
Presentation Transcript
Histogram Processingand spatial filtering Chapter 3 (cont.)
Histogram Processing Topics • Histogram Processing • Histogram Equalization • Histogram Matching (Specification) • Local Histogram Processing
Image Histograms • Basic for numerous spatial domain processing techniques • Histogram manipulation can be used efficiently for image enhancement • Provide useful image statistics • Useful in other image applications: • Image Compression • Image Segmentation
Image Histograms • The histogram of an image shows us the distribution of grey levels in the image. • Massively useful in image processing, especially in segmentation.
Histogram Processing: • The histogram of a digital image with gray levels in the range [0, L-1] is a discrete function h(rk) = nk • Where • rk: the kth gray level • nk : the number of pixels in the image having gray level rk • h(rk) : histogram of a digital image with gray levels rk.
Normalized Histogram • Dividing each of histogram at gray level rk by the total number of pixels in the image, n p(rk)= nk/n For k = 0,1,…,L-1 • p(rk) gives an estimate of the probability of • occurrence of gray level rk • The sum of all components of a normalized histogram is equal to 1
Histograms Examples • The shape of a histogram provides useful information for contrast enhancement • Notice the relationships between the images and their histograms.
Histogram Equalization • What is the histogram equalization? • The histogram equalization is an approach to enhance a given image. The approach is to design a transformation T(r) such that the gray values in the output is uniformly distributed in [0 L-1]. • Let us assume for the moment that the input image to be enhanced has continuous gray values, with r = 0 representing black and r = L-1 representing white. • We need to design a gray value transformation s = T(r), based on the histogram of the input image, which will enhance the image.
Histogram Equalization • Monotonicity condition preserves the increasing order from black to white in the output image thus it won’t cause a negative image • 0 ≤ T(r) ≤ L-1 for 0 ≤ r ≤ L-1 guarantees that the output gray levels will be in the same range as the input levels. • The inverse transformation from s back to r is denoted by • r = T -1 (s) ; 0 ≤ s ≤ L-1
Probability Density Function(PDF) • The gray levels in an image may be viewed as random variables in the interval [0,1] • PDF is one of the fundamental descriptors of a random variable. Applied to Image • pr(r) denote the PDF of random variable r • ps (s) denote the PDF of random variable s • The PDF of the transformed variable s is determined by the gray-level PDF of the input image and by the chosen transformation function.
Histogram Equalization • Thus, an output image is obtained by mapping each pixel with level rkin the input image into a corresponding pixel with level skin the output image. • How to implement histogram equalization????
Implementing Histogram Equalization • For discrete values, we deal with probabilities (histogram values) and summations. The probability of occurrence of intensity level rkin a digital image is approximated by: • pr(rk) = nkk= 0,1,2,…,L −1 MN Where MN is the total number of pixels in the image, nkis the number of pixels that have intensity rk, and L is the number of possible intensity levels in the image.
Implementation • The discrete form of the transformation is: sk= T(rk) = (L-1)Σ pr (rj), where j = 0-k Thus a processed (output) image is obtained by mapping each pixel in the input image with intensity rkinto a corresponding pixel with level skin the output image using the above formula.
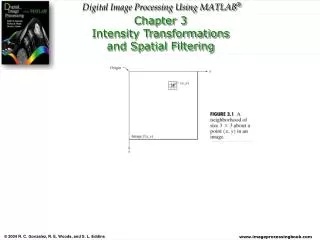
Example: • Suppose that a 3-bit image (L=8) of size 64*64 pixels (MN = 4096) has the intensity distribution shown in table 3.1, where the intensity levels are integers in the range [0,L-1] = [0,7].
Example (cont.) s0 = T(r0) = 7Σ pr (r0) = 7 pr (r0) = 7*0.19 = 1.33 s1= 3.08, s2 = 4.55, s3= 5.67, s4= 6.23, s5= 6.65, s6= 6.86, s7= 7.00. This transformation function has the staircase shape shown in Fig.3.19(b).
Example (cont.) • At this point, the s values still have fractions because they were generated by summing probability values, so we round them to the nearest integer: s0 =1.33 1 s1= 3.08 3 s2= 4.55 5 s3= 5.67 6 s4= 6.23 6 s5= 6.65 7 s6= 6.86 7 s7= 7.00 7
Histogram Matching (Specification) • It is the method used to generate a processed image that has a specified histogram. • Histogram equalization has a disadvantage which is that it can generate only one type of output image. • With Histogram Specification, we can specify the shape of the histogram that we wish the output image to have. • It doesn’t have to be a uniform histogram.
Local Histogram Processing • The histogram methods discussed previously are global that means that the transformation function affects the entire image. There are cases to enhance details over small areas in an image this is called local enhancement. • Local enhancement is done by applying the transformation function over the intensity distribution in a neighborhood of every pixel in the image. • The procedure is to define a neighborhood and move its center from pixel to pixel. At each location the histogram of the points in the neighborhood is computed and either a histogram equalization or specification is obtained.
Explain the result in c) • Basically, the original image consists of many smallsquares inside the larger dark ones. However, the small squares were too close in gray level to the larger ones, and their sizes were too small to influence global histogram equalization significantly. • So, when we use the local enhancement technique, it reveals the small areas.