% cell viability
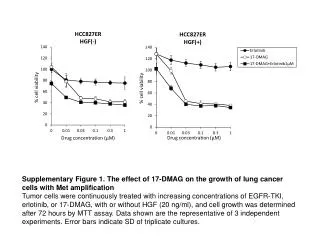
HCC827ER HGF(-). HCC827ER HGF(+). % cell viability. % cell viability. Drug concentration (μM). Drug concentration (μM). Supplementary Figure 1. The effect of 17-DMAG on the growth of lung cancer cells with Met amplification

% cell viability
E N D
Presentation Transcript
HCC827ER HGF(-) HCC827ER HGF(+) % cell viability % cell viability Drug concentration (μM) Drug concentration (μM) Supplementary Figure 1. The effect of 17-DMAG on the growth of lung cancer cells with Met amplification Tumor cells were continuously treated with increasing concentrations of EGFR-TKI, erlotinib, or 17-DMAG, with or without HGF (20 ng/ml), and cell growth was determined after 72 hours by MTT assay. Data shown are the representative of 3 independent experiments. Error bars indicate SD of triplicate cultures.
PC-9 HGF(-) H1975 HGF(-) % cell viability % cell viability Drug concentration (μM) Drug concentration (μM) PC-9 HGF(+) H1975 HGF(+) Ma-1/HGF % cell viability % cell viability % cell viability Drug concentration (μM) Drug concentration (μM) Drug concentration (μM) Supplementary Figure 2. The effect of combined therapy with 17-DMAG and EGFR-TKI on the growth of lung cancer cells with mutated EGFR Tumor cells were continuously treated with increasing concentrations of EGFR-TKI, erlotinib (PC-9 and Ma-1/HGF), CL-387,785 (H1975), or 17-DMAG, with or without HGF (20 ng/ml), and cell growth was determined after 72 hours by MTT assay. Data shown are the representative of 3 independent experiments. Error bars indicate SD of triplicate cultures.
Supplementary Figure 3. HGF (ng/ 2×10⁵cells) < 0.1 < 0.1
Control Erlotinib 17-DMAG HGF HGF+Erlotinib HGF+17-DMAG Ma-1 Ma-1/Vec PI 2.90 31.52 35.49 3.05 5.44 24.89 2.85 1.64 14.01 12.11 0.69 15.64 Ma-1/HGF AnnexinV 2.64 4.04 17.81 Supplementary Figure 4. 17-DMAG induces apoptosis even in the presence of HGF. Ma-1, Ma-1/Vec, and Ma-1/HGF cells were incubated with HGF (20 ng/mL) and erlotinib (0.3 μmol/L) or 17-DMAG (0.3 μmol/L) for 48 hour and washed twice with PBS. The apoptotic cells were determined by Annexin V assays according to the manufactor’s protocol. Values shown are percentage of apoptotic cells. FL1-H and FL2-H, heights of fluorescence intensity.
A C 1 5 2 6 3 7 4 8 B 1: Ma-1 Control 2: Ma-1 Erlotinib 3: Ma-1 17-DMAG 4: Ma-1 Combination 5: Ma-1/HGF Control 6: Ma-1/HGF Erlotinib 7: Ma-1/HGF 17-DMAG 8: Ma-1/HGF Combination Supplementary Figure 5. The effect of combination treatment with 17-DMAG plus erlotinib to HGF-induced erlotinib resistance in vivo. Ma-1 /Vec (A) or Ma-1/HGF (B) (5 × 10⁶) cells were inoculated subcutaneously into SCID mice on day 0. Mice received oral erlotinib (20 mg/kg/d) and/or intraperitoneal 17-DMAG (10 mg/kg/d), starting on day 7. Tumor size was measured twice a week and tumor volumes were calculated as described in Materials and Methods. Error bars indicate standard errors of 6tumors. C, macroscopic appearances of representative tumors harvested on day 21.
Supplementary Figure 6. Control Erlotinib 17-DMAG Ma-1/Vec Ma-1/HGF
Supplementary Figure 7. Control Erlotinib 17-DMAG Ma-1/Vec Ma-1/HGF