Download
1 / 17
170 likes | 194 Vues
Understand grid generation choices, reliability, challenges, and power technologies. Discover peak, intermediate, and base load generation and how they shape the grid. Explore the impact of renewables, environmental factors, and societal demands.

E N D
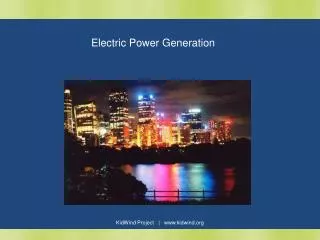
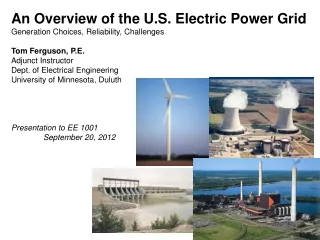
An Overview of the U.S. Electric Power Grid Generation Choices, Reliability, Challenges Tom Ferguson, P.E. Adjunct Instructor Dept. of Electrical Engineering University of Minnesota, Duluth Presentation to EE 1001 September 20, 2012
What Do We Know About This? • We plug LOADS into it • It has THREE prongs in standard layout • The VOLTAGE is ~115 VAC • The WAVEFORM is sinusoidal • Only 60 HZ is present • ELECTRONS come from somewhere • It’s almost always “ON” • BUT! • Limited to 15 AMPS • Europe uses different plug • Voltage varies + 5% • Waveform is usually not “clean” • Harmonics may be present • Electrons come from ALL generators • It’s 99.99% reliable (off for 53 minutes/yr)
The Grid Powers Society • Human behavior repeats itself daily • Morning routine: lights, hot water, electronics • Stores open: lights, heating/cooling • Industry starts: pumps, motors, arc furnaces • The grid must respond to these loads • generators must be ready and reliable • generators must be controllable to match load • transmission/distribution lines must be intact • It had better work well, as loads increase quickly
A Typical Day on the California Grid 1 Megawatt can power about 1000 homes Ramps up by 4500 MW in 80 minutes 2 p.m. 4 a.m.
Generating Choices • What types of generation are used? • Varies across U.S. according to • availability of fossil fuels • availability of renewable energy sources • water availability • environmental limitations • state policies on renewables and nonrenewable generation
Generating Choices • Generators usually fall into one of 3 regions: • Base Load • Must run essentially 24/7 annually • Expensive to build, but provides lowest cost over time • Intermediate Load • Must run perhaps 50% of time • Less costly to build, but more costly to run • Peak Load • Runs only to meet peak demands • Least expensive to build, most costly to run • We can visualize these regions on a Load Duration Curve
Peak Load Gen Intermediate Load Generation Base Load Generation
Includes • Hydro • Biomass • Wind • Solid Waste • Geothermal • Solar PV • Solar Thermal Percentages on an ENERGY basis, not capacity.
Where Do These Technologies Fit on our Load Duration Curve? Peak Load Gen Gas, Hydro Intermediate Load Generation Hydro, Natural Gas, Solid Waste Base Load Generation Nuclear, Coal, Geothermal, Wind*, Solar* *Wind and solar output must be taken when available, sometimes affecting baseload gen
Challenges with Wind • Adds no inertia to grid (no energy storage) • Poor low-voltage behavior • Limited contribution to peak load capability • Not dispatchable • Negative correlation with loads When loads are greatest during the mid-day, wind generation is lowest. Conversely, wind is highest when least needed (night).
Tying Generators Together with Loads • High Voltage Transmission Lines • Connect generators with loads • Transmit energy at near speed of light • High voltage reduces current flow (P=V x I) • Reduced current reduces losses (Ploss=I2R)
Tying Generators Together with Loads • Three Synchronized Regions in U.S. • Eastern U.S. (east of Rockies) • Western U.S. • Texas • All generators in each region are synchronized
Putting It All Together “The Grid” = Generators (about 18,000) + HV Transmission Network In 2008, 356 new, large-scale generators were added to the US grid
Grid Reliability • Standards exist to ensure reliability • Extensive filings and audits • Severe financial penalties • Wide-area (multi-state) reliability affected by: • Major outages of generators or transmission lines • Growth of non-dispatchable wind and solar • Inability to run existing or build new baseload gen • Climate change: warmer water and less of it • Local reliability affected by: • Lightning and high winds • Animals (squirrels, rodents, snakes) • Right-of-way incursions (traffic accidents, train derailments)