Download
1 / 15
150 likes | 270 Vues
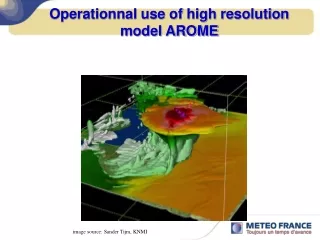
Prediction of the 10 July 2004 Beijing Flood with a High-Resolution NWP model. Ying-Hwa Kuo 1 and Yingchun Wang 2 1. National Center for Atmospheric Research, USA 2. Beijing Meteorological Bureau, China. Model Configuration. Two domain, run in two-nested mode Domain 1: 12 km; domain 2: 4 km

E N D
Prediction of the 10 July 2004 Beijing Flood with a High-Resolution NWP model Ying-Hwa Kuo1 and Yingchun Wang2 1. National Center for Atmospheric Research, USA 2. Beijing Meteorological Bureau, China
Model Configuration • Two domain, run in two-nested mode • Domain 1: 12 km; domain 2: 4 km • Physics used in domain 1: • KF CU, YSU PBL, 5-layer soil model (not LSM), RRTM lw, Dudhia sw • Physics used in domain 2: • Same as in domain 1, except no KF • Two different micropysics options: Lin et al. (1983) and WSM-6
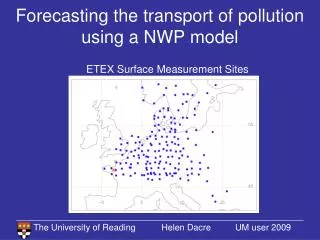
Data Used • NCEP Global Forecast System (GFS) final analysis at 1 degree resolution • Radiosonde, surface and AWS observations obtained from Beijing Meteorological Bureau (BMB) • Ground-based GPS PW from Fang Shan obtained from BMB
Experiments • Control: or experiment A • GFS data only, used for both IC and BC • 3DVAR 1: or experiment B • GFS + radiosonde, sfc + AWS • 3DVAR 2: or experiment C • GFS + radiosonde, sfc + AWS + GPS PW • All experiments start at 1200 UTC 7/9/04 and run for 36 hours
6-h accumulated rainfall 06-12 UTC 10 July 2004 BMB+PW BMB Lin et al Microphysics
6-h accumulated rainfall 06-12 UTC 10 July 2004 WSM-6 BMB+PW Lin et al.
BMB+PW 4-km WRF Radar ref. Wind at 1km Lin et al. microphysics
BMB+PW 4-km WRF Radar ref. Wind at 1km WSM-6 microphysics
Differences of WSM-6 from Lin et al. microphysics • Differences in the assumption of particle size and number distributions for ice particles. • Melting is done on small fall-term timesteps to make it more accurate as a function of height. • Saturation processes are difference. • Line et al. use some combined ice/water saturation vapor pressure based on temperature • WSM-6: Ice particles respond to ice saturation and water particles respond to water saturation. • Accretion of particles takes into account of the fall speeds of both species, not just the faster falling species.
The GPS network in FangShan Beijing area of China . 8 GPS Stations with mean distance less than 10km . A Vaisala AWS(P,T,RH) built on each GPS station . YSDD->54511 ~ 30 km . YCSS->RAIN_GAUGE ~ 5km 54511(Brown Square): The Radiosonde Station RAIN_GAUGE(Green Diamond): The FangShan AWS Black triangle: Four Single Frequency GPS Stations of BMB Black circle: Four Dual Frequency GPS Stations of BMB
30km 0709 0710 0711
0709 0710 0711
Preliminary Conclusions • WRF 4-km model initialized with the NCEP GFS analysis did not produce any precipitation over Beijing. GFS is quite good on the larger scale, it is the mesoscale details that it fails to capture. • WRF 3D-Var assimilation of local data set makes a big difference in the stability of the local convective environment. • Simulation of convective evolution is sensitive to quality of mesoscale analysis and precipitation microphysics