Understanding Aggregate Supply and Demand: The Consumption Function and Economic Performance
This content explores the Aggregate Supply and Demand model, focusing on the Consumption Function as introduced by John Maynard Keynes. It emphasizes the relationship between consumption and savings, particularly in a private or closed economy without international influences. Key concepts include the role of disposable income on consumer spending, the significance of the Marginal Propensity to Consume (MPC) and Save (MPS), the Multiplier Effect, and the implications of fiscal policy on economic performance. Additionally, it addresses non-income determinants of consumption and their influence on economic stability.


Understanding Aggregate Supply and Demand: The Consumption Function and Economic Performance
E N D
Presentation Transcript
Consumption Function • Development • John Maynard Keynes originated idea • Measures economic performance of an economy • Focuses on the relationship b/w Consumption & Savings • Simplifications • Private/closed economy (no int’l influence & gov’t ignored) • C + Ig • Assume that all saving is personal • Depreciation & net foreign factor = 0 • Reminder: w/ no gov’t or foreign trade, • GDP = NI = PI = DI (all the same!)
Consumption Function • Tools • Theory assumes that the level of output & employment depend directly on the level of aggregate expenditures • Changes in output reflect changes in agg. spending • Consumption • The most important determinant of consumer spending is DI (income) • 45° angle represents all points where consumer spending equals DI (1:1) • 45° line represents zero savings • If DI increases, both consumption & savings will increase
Consumption Function • Tools • Consumption Schedule • Historically, households spend a larger proportion of small income than of a larger income • Breakeven: C = DI • total income level when H consume all income • Dissavings occurs at low levels where consumption exceeds income & households must borrow (credit cards)
Consumption Function • Tools • Non-income Determinants of Consumption & Saving • Wealth • Expectations • Household Debt • Taxation • Shifts & Stability • Consumption & saving schedules will shift in opposite directions • UNLESS caused by a tax change • Consumption & saving schedules are generally stable unless deliberately shifted by gov’t action
Consumption Function 1:1 Savings Consumption $500 Break Even Dissavings 45° $500 DI
Savings Function Savings Savings Dissavings Break Even DI
Marginal Propensity to Consume & Save • MPC: what effect a ∆ Income has on amount C • MPC = change in consumption • change in income • MPS: what effect a ∆ Income has on amount S • MPS = change in saving • change in income • MPC + MPS = 1
Marginal Propensity to Consume & Save • Calculate MPC/MPS • If disposable income changes from $10,000 to $12,000 and consumption changes from $9,000 to $10,000: • What is MPC? • What is MPS? • Why do MPC & MPS always equal 1?
The Multiplier Effect • Why do cities want the Superbowl in their stadium? • An initial change in spending will set off a spending chain that is magnified in the economy. • Example: • A Seahawks fan spends $120 on dinner at John’s diner. • John’s income has increased by $120. • John spends $100 on a new bench from Carol’s furniture shop. • Carol spends $80 on wood from Dan’s lumber yard. • Dan spends $50 on lunch at Sharon’s restaurant… • The Multiplier Effect shows how spending is magnified in the economy & doesn’t end at the initial purchase/investment.
Multiplier • Multiplier Effect • Any increase in spending will result in an even larger increase in GDP due to the fact that every $ spent is spent again multiple times. • Increases in spending can come from either government (G) or businesses (Ig) • Any money spent is someone else’s income & thus subject to spending. • Contingent on MPC & MPS … WHY? • Limiting factor of multiplier is MPS • Multiplier = 1/MPS or 1/(1-MPC) • Larger the MPC, larger the multiplier
Multiplier • What is the multiplier if the MPC is equal to ¾? • 1 / (1 - 0.75) = 4 • What is the multiplier if the MPC is equal to 9/10? • 1 / (1 - 0.9) = 10 • What is the multiplier if the MPS is 1/5? • 1 / 0.2 = 5
Multiplier • Multiplier Effect • Multiplier is used to calculate how any change in spending will change total spending (AD) or income (GDP) • ∆ Spending x Multiplier = ∆ AD/GDP George Bush, in an effort to increase GDP during a recession, proposed a stimulus package which provided every American family with $200 more of disposable income. The marginal propensity to consume at that point in time was 0.75. Calculate the multiplier and identify how much more spending this would generate per family. 1/0.25 = 4 4 x 200 = $800
Multiplier • Would the multiplier be larger or smaller if people saved more of their additional income? (MPS = .25 vs. .3) • Smaller ( 4 vs. 3.33) • What would happen to the multiplier if people saved all of their income? • It would be 1 & thus spending doesn’t multiply (Multiplier = 1/1) • What would happen if people spent all of their income? • It would be infinite & thus spending would be replicated for every transaction (Multiplier = 1/0)
Multiplier • If the multiplier were 4, how much money would the gov’t spend to increase aggregate demand by $1 million? • $250,000 ( spending x 4 = 1,000,000 ) • If the gov’t needed to cut AD by $2 million and the multiplier were 4, how much would gov’t spending have to be reduced? • $500,000 ( spending x 4 = 2,000,000 )
Multiplier • How does the multiplier explain why changes in investment spending cause large fluctuations in GDP? • Because increases in investment cause endogenous increases in consumption, the ultimate increase in GDP is larger than the initial investment • i.e. minor injections/leakages cause even greater growth of GDP ($1 M injection can yield growth of $5 M)
MPS/MPC& Multiplier • If disposable income changes from $15,000 to $19,000 and saving changes from $10,000 to $11,000: • MPS: .25 • MPC: .75 • The MULTIPLIER: 4
MPS/MPC & Multiplier • If disposable income changes from $15,000 to $16,000 and consumption changes from $10,000 to $10,750: • MPS: .25 • MPC: .75 • The MULTIPLIER: 4
Interest Rates & Investment Demand • What is investment? • Investment decisions made using cost/benefit analysis. • Benefit = expected rate of return (r) • Cost = interest rates –the “cost” of money (i) • make sure iis adjusted for inflation • Rules: • If expected return ≥ real interest – INVEST • If expected return < real interest – DO NOT
Interest Rates & Investment Demand Why is the ID downward sloping?
Shifts in Investment Demand • Cost of Production • Lower costs shift ID Higher shifts ID • Business Taxes • Lower business taxes shift ID Higher shifts ID • Technological Change • New technology shifts ID • Stock of Capital • Low on capital shifts ID High shifts ID • Expectations • Positive expectations shifts ID Negative shifts ID
Interest Rates & Investment Demand The real interest rate is 2%. What is investment at that level?
Investment Schedule If real interest rate was 2%, we would assume that businesses are investing $2T at all levels of output. The amount invested is very unstable/volatile, however, and investment can & does occur irregularly. $2 T Ig investment $1.8 Ig0 GDP = DI
Aggregate Expenditures Model • Measures Aggregate Demand/Expenditures against real GDP • POLICY GOAL IS TO MOVE IT UP (increase GDP) • Leakages (withdrawal of spending from income/expenditure stream) imports, taxes, savings • Injections (addition of spending to the income/expenditure stream) spending (G or Ig), investment, net exports • Must equal each other: S( savings) + M ( imports) + T ( taxes) = I ( investments) + X ( exports) + G( government purchases)
C + Ig C Aggregate Expenditures Model 1:1 AD/AE Equilibrium GDP is the intersection of ____ & ____. 45° GDP (NI, NO)
International Trade & Equilibrium Output • Xn & Aggregate Expenditures • Closed economy: • AE = C + Ig • Open economy: • AE = C + Ig + Xn • Measuring AE for domestic goods (X – M)
Government Purchases & Equilibrium GDP • A mixed economy – adding gov’t spending & taxes. • Government spending is subject to the multiplier. • Balanced Budget Multiplier: a change in G is more powerful than a tax change of the same size \ • (spend & tax at same amount will yield growth) • Taxesare leakages • Lump Sum: tax that provides equal amounts of revenue at each level of GDP • a tax increase shifts AE downward only by the amount of the tax times the MPC
C + Ig + G + Xn C + Ig + G C + Ig + G + (Xn) C + Ig C Aggregate Expenditures Model 1:1 AD/AE U. S. 45° GDP (NI, NO)
Government Purchases & Equilibrium GDP • Recessionary Gap: • The amount by which AE at full employment GDP falls short of those required to achieve full employment GDP • Inflationary Gap • The amount by which an economy’s AE at full employment exceeds those just necessary to achieve full employment
C + Ig C Aggregate Expenditures Model 1:1 AD/AE 45° GDP (NI, NO)
AE1 (at P1) AE Model AD Curve 1:1 AD/AE Price Level P2 AE2 (at P2) P1 GDP 3500 4000 45° Thus, GDP is less at P2 (higher price level) than P1 AD 0 3500 4000 GDP
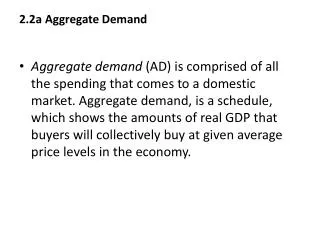
Aggregate Demand • Shows the amounts of real GDP that buyers desire to purchase at each price level. • If the price level: • Increases (inflation), then Real GDP demanded ___ • Decreases (deflation), then Real GDP demanded ___ Price Level Real domestic output (GDPR) AD = C + I + G + Xn
Aggregate Demand • Why downward slope? • Real-Balances Effect: • price level reduces purchasing power – GDP • Interest Rate Effect: • price level leads lenders need to charge higher interest rates – GDP • Foreign Purchases Effect: • price level reduces foreign D of U.S. goods & increases U.S. D of foreign goods – GDP (due to –Xn)
Determinants of Aggregate Demand An increase in spending shifts AD right & decrease in spending shifts AD left. Price Level AD1 AD = C + I + G + Xn AD2 Real domestic output (GDP)
Determinants of Aggregate Demand • Change in Consumer Spending • Consumer Wealth(Boom in the stock market…) • Consumer Expectations(People fear a recession…) • Household Indebtedness(More consumer debt…) • Taxes(Decrease in income taxes…) • 2. Change in Investment Spending • Real Interest Rates (Price of borrowing $...) • Rate of Return: • Future Business Expectations (High expectations…) • Productivity and Technology (New robots…) • Business Taxes (Higher corporate taxes…)
Determinants of Aggregate Demand • Change in Government Spending • (War…) • (Decrease in defense spending…) • Change in Net Exports (X-M) • Exchange Rates • (If the us dollar depreciates relative to the euro…) • National Income Abroad AD = GDP = C + I + G + Xn
Aggregate Supply • Shows the level of real GDP that firms will produce at each price level. • Three ranges: Price Level D Classical C B A Keynesian Q3 Q1 Q2 GDPR
Cost-Push Inflation vs. Demand Pull Inflation • Outcome on price level is the same, but GDP differs. Price Level AS AD D Classical C B A Keynesian Q3 Q1 Q2 GDPR
SRAS & LRAS • AS differentiates b/w short-run & long-run • SRAS: immediately after change in PL (input costs haven’t yet adjusted to change in PL) • LRAS: measures potential output / NRU; point at which input prices have adjusted to change in PL
Actual GDP = SRAS Potential GDP = LRAS
SRAS & LRAS • The LRAS & SRAS curves also indicate our PPF & can be used to identify GDP gaps. Price Level SRAS LRAS C Consumer Goods P1 A B Capital Goods 500 GDPR 600 550
Determinants of Aggregate Supply • Firms are able to produce more or less at every price level. • per-unit production costs change for reasons outside changes in real GDP • SRAS shifters mostly Price Level AS3 AS1 AS2 GDPR Q3 Q1 Q2
Determinants of Aggregate Supply • Inputs • Costs of Domestic Resources • Factors of Production • Cost of Imported Resources • Exchange rate value • Market Power • Competition
Determinants of Aggregate Supply • Legal-Institutional Environment • Business taxes & subsidies • Gov’t regulation: • Anti-trust laws • Labor laws • Environmental laws • Productivity • worker education • management skill • technology
Equilibrium Price Level & Real Output • Shifts in SRAS/AD will reveal inflationary/recessionary gaps. Price Level Recessionary Gap Inflationary Gap LRAS GDPR
Fiscal Policy • The use of government spending (the BUDGET) & revenue collection (TAXES) to influence the economy • Fiscal year • October 1- September 30 • Federal Budget: • Revenues = Spending… Balanced Budget • Revenues > Spending… Budget Surplus • Revenues < Spending… Budget Deficit
National Debt Federal Debt = accumulated deficits - accumulated surpluses $17.3 T
Types of Fiscal Policy • Contractionary: works to fight inflation but can lead to a fall in GDP. • Raise taxes: take money out of circulation • Reduce gov’t spending: cuts back on funding social programs & business contracts • Results in… • Budget surplus TOOLS Resolves inflationary / recessionary gap. Republicans would prefer which option?