Download
1 / 115
1.16k likes | 1.41k Vues
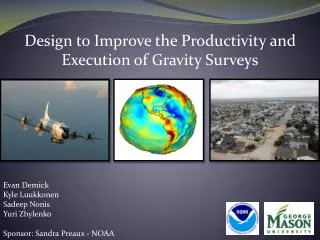
Design to Improve the Productivity and Execution of Gravity Surveys. Evan Demick Kyle Luukkonen Sadeep Nonis Yuri Zhylenko. Sponsor: Sandra Preaux - NOAA. Agenda. Context Review Stakeholder Analysis Problem & Need Statements Method of Analysis & Simulation

E N D
Design to Improve the Productivity and Execution of Gravity Surveys Evan Demick Kyle Luukkonen SadeepNonis Yuri Zhylenko Sponsor: Sandra Preaux - NOAA
Agenda • Context Review • Stakeholder Analysis • Problem & Need Statements • Method of Analysis & Simulation • Recommendation & Conclusion
What is a Gravity Survey? • Collection of measurements of the acceleration of gravity. • Accelerations are used to model the earth’s geoid. • The geoid model is used to determine elevations. • Mountains have greater mass than a valley, so the pull of gravity is stronger near mountains http://celebrating200years.noaa.gov/foundations/gravity_surveys/welcome.html
Importance of Gravity Surveys • Accurately measure the height and flow of water in flat areas to make efficient use of water resources. • Variations in gravity represent different densities beneath the surface. • Variations may represent petroleum, natural gas, and various metals. • Plan evacuation routes for low lying coastal areas. • FEMA requires the use of survey data for flood control certificates. http://www.ngs.noaa.gov/PUBS_LIB/SocioEconomicBenefitsofCORSandGRAV-D.pdf
History of Gravity Surveys • National Geodetic Vertical Datum of 1929 (NGVD 29) • Originally known as the Sea Level Datum of 1929. • Based on mean sea level (MSL) at 26 tidal gauges between the United States and Canada. • 21 in the U.S. and 5 in Canada • Defined by the observed heights at each tidal gauge and the elevations of all benchmark locations. • MSL is not a constant. • Impacted through wind, atmospheric pressure, water temperature and salinity. http://geodesy.noaa.gov/GRAV-D/pubs/GRAV-D_v2007_12_19.pdf
History of Gravity Surveys • North American Vertical Datum of 1988 • NAVD ‘88 was established in 1991 to replace NGVD 29’. • Data points collected through geodetic leveling and satellites. • Data is very sparse. • Errors in measurements as high as 2 meters. • Majority of data collected in the 70’s and 80’s. http://geodesy.noaa.gov/GRAV-D/pubs/GRAV-D_v2007_12_19.pdf
Gravity for the Redefinition of the American Vertical Datum (GRAV-D) • Created in 2007 to complete a thorough survey of the gravity field over the United States and it’s territories. • NGS Federally Mandated project (80-373). • Designed to replace existing gravity measurements from NAVD ‘88. • Could see a potential economic benefit of $4.8 billion over fifteen years. • Based primarily on flood plain mapping and avoidance costs for leveling. http://geodesy.noaa.gov/GRAV-D/pubs/GRAV-D_v2007_12_19.pdf
Annual Target Identification • Percentages represent the annual goals for the GRAV-D projectstarting in FY2013. • Currently, NOAA has been reaching their yearly targets of 5.6% per year. • NOAA will need to increase yearly output to 8% to reach 2022 completion goal.
Project Gap 23% Targeted Completion Year - 2022
Historical Survey Data • Timeframe – 2008 through 2012 • Important factors • Weather, Aircraft Maintenance, Aircraft Repair, Instrument Issues, and Personnel Days.
Deming’s Theory Theory - Anomalies in quality are variations outside the control limits of a process. W. Edwards Deming • To meet program target completion goals the variation of the delays in each process must be reduced. Quality Variance
Agenda • Context Review • Stakeholder Analysis • Problem & Need Statements • Method of Analysis & Simulation • Recommendation & Conclusion
Agenda • Context Review • Stakeholder Analysis • Problem & Need Statements • Method of Analysis & Simulation • Recommendation & Conclusion
Problem Statement • NOAA has to reach 8% geographic area coverage annually. • A plan to reduce variability within the gravitational survey is needed to maximize coverage within budget. • Before Fiscal Year 2022
Need Statement • NOAA must complete the 8% annual quota but receives limited funding from the Department of Commerce. • Making the gravity survey reduce variability will remove the tension with the Department of Commerce on NOAA’s need for more financial backing by decreasing the time needed to complete a survey block.
Agenda • Context Review • Stakeholder Analysis • Problem & Need Statements • Method of Analysis & Simulation • Recommendation & Conclusion
Design Alternatives • Alternative 1 • Focus on Logistics Process • Improve the execution of gravitational surveys and reduce variance in several variables which cause extra delays and unnecessary downtime. • Alternative 2 • Acquire additional resources • The number of aircraft, equipment suites, and personnel limits the amount of surveys that can be completed annually. • Alternative 3 • Combine Alternatives 1 & 2 • Maximizes the output, but is constrained by budget.
Simulation • Used historical data to build a distribution for each process block. • Assume process independence. • Run the simulation for 10,000 replications and compare results.
Verification – Data Comparison • Simulation Output (Base Case) • Mean: 44.01 days • Worst case: 110.45 days • Historical Data Analysis • Mean: 41.63 days • Worst Survey: 76 days • Worst Values: 130 days
Verification – Data Correlation • Symmetric correlation coefficient • Negative relationship – As the duration of one process increases, the duration of the corresponding process decreases • Positive relationship – As the duration of one process increases, the duration of the corresponding process increases
Design of Experiment • Reduce the variance of each input variable by 5%, 10%, 15%, 20%, and 25%. • Run 10,000 replications after each change. • Calculate the days to completion. • (10%) = (μ - min) * 0.2 + min • (50%) = μ • (90%) = (max - μ) * 0.8 + μ • Analyze which variables have the biggest impact on the survey by subtracting the new value from the base case.
Agenda • Context Review • Stakeholder Analysis • Problem & Need Statements • Method of Analysis & Simulation • Recommendation & Conclusion
Recommendations • Alternative 1 – Focus on the logistics process of the surveys by allocating budget and resources towards improving parameters based on their rank in variability. • This method has the least cost while still providing good way for survey execution based on the output value. • Follow delay mitigation strategies to maximize the performance and data gathering of the survey.
Conclusion • Variability reduction will reduce the time to conduct an average survey by 3 - 9 days based on 25% variability reduction. • More surveys will be completed in 44 days or less. • Save up to 47.4 days of survey time annually. • Enough time to conduct another survey. • Fewer days spent on survey results in less spending.
Design to Improve the Productivity and Execution of Gravity Surveys Evan Demick, Kyle Luukkonen, SadeepNonis, Yuri Zhylenko
National Geodetic Survey • The National Geodetic Survey (NGS) has a clearly defined mission statement: • “Define, maintain and provide access to the National Spatial Reference System (NSRS) to meet our nation’s economic, social, and environmental needs.” (NOAA 2012) • The National Geodetic Survey (NGS) is a government supported program that provides positioning information to the nation. • NGS has several different projects currently underway (including GRAV-D and CORS) to aid in the measuring of elevation, longitude, latitude, and shoreline data.
History of Gravity Surveys • NAVD ‘88 was established in 1991 to replace the existing Sea Level Datum from 1929. • Surface measurements were taken using a technique called leveling. • Surveys were conducted overmany years by numerous outside sources. • Data is very sparse. • Locations like Alaska have very few measurements due to terrain. • A gap is also present along the coastlines. http://geodesy.noaa.gov/GRAV-D/pubs/GRAV-D_v2007_12_19.pdf
North American Vertical Datum • Measurements are outdated and have been skewed due to crustal movements (last collected in the 70’s and 80’s). • Many markings have been destroyed by regional development and poor maintenance. • There is a transcontinental tilt from the SE to NW of the U.S. for short wavelength gravity measurements. • Errors in measurements as high as 2 meters. http://geodesy.noaa.gov/GRAV-D/pubs/GRAV-D_v2007_12_19.pdf
Importance of Gravity Surveys • FEMA requires the use of survey data for flood control certificates. • Floodplain maps also determine whether or not homes or buildings require flood insurance under the National Flood Insurance Program • A FEMA run program with over $650 billion in insured assets. • Mapping gravity can improve the accuracy of atomic clocks which are used in many electronic systems. • Provide measurements that are geographically continuous rather than points based on physical monuments. http://www.ngs.noaa.gov/PUBS_LIB/SocioEconomicBenefitsofCORSandGRAV-D.pdf
Importance of Gravity Surveys Floodplain maps are used to determine land use and building code requirements. Builders must have site plans and matching elevation data to help minimize any potential damage. Planning the development of new buildings and infrastructure. Variations in gravity represent different densities beneath the surface which can be used to detect petroleum, natural gas, and various metals. • Mapping gravity can improve the accuracy of atomic clocks which are used in many electronic systems. • Provide measurements that are geographically continuous rather than points based on physical monuments.
Importance of Gravity Surveys • Road construction currently uses conventional geodetic leveling. • Upgraded gravity surveys could replace conventional leveling for road works and save state and local municipalities as much as $300 billion per year. • Replace leveling for sewage systems, water supply, and mass transit activities. • Monitor changes over time in crustal motion to predict earthquakes and water flow. http://www.ngs.noaa.gov/PUBS_LIB/SocioEconomicBenefitsofCORSandGRAV-D.pdf
GRAV-D Objectives • Redefine the US vertical datum and replace geodetic leveling in large areas with GPS measurements and a gravimetric geoid model to determine orthometric heights. • Redefine and improve the vertical component of NSRS. • Provide a vertical datum that is more economical than traditional leveling. http://www.ngs.noaa.gov/PUBS_LIB/SocioEconomicBenefitsofCORSandGRAV-D.pdf
Equipment • A test mass is first dropped and allowed to fall freely inside a vacuum chamber. • The test mass will fall roughly 7 cm and the actual distance will be measured precisely using a laser interferometer and a rubidium standard atomic clock. • As the test body falls, optical interference fringes are generated by the laser interferometer. • These fringes are counted and timed with the atomic clock. • The measurements of time and distance are then fitted to a parabolic trajectory that produces an accurate measure of the gravitational acceleration. • The A10 provides measurements without the need for post-processing, and so reduces any additional overhead required to run the machine.
Areas with Completed Surveys • The GRAV-D program has already covered several areas since starting in 2007. • Eastern Alaska. • Gulf of Mexico (focusing primarily on Louisiana and areas struck by Hurricane Katrina). • The Great Lakes Region. • California Coastline. http://geodesy.noaa.gov/GRAV-D/pubs/GRAV-D_v2007_12_19.pdf
Survey Area Layout http://geodesy.noaa.gov/GRAV-D/pubs/GRAV-D_v2007_12_19.pdf