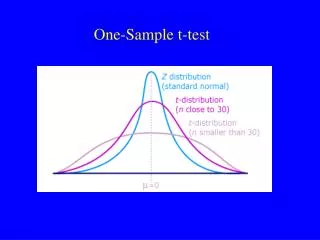
One-Sample t-test
One-Sample t-test. What do these problems we have been working on have in common?.

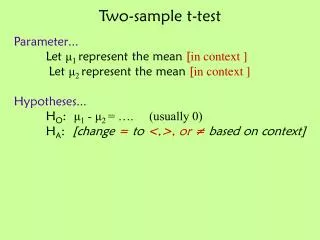
One-Sample t-test
E N D
Presentation Transcript
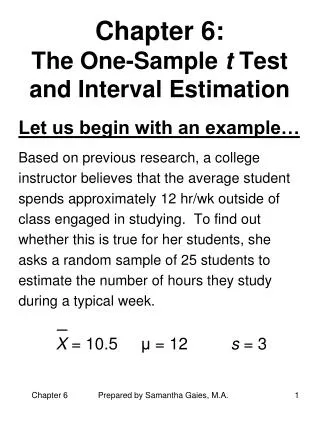
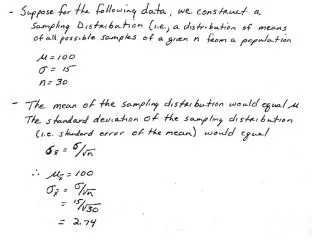
What do these problems we have been working on have in common? In a population of American graduate students, individuals earn on average $7.25/hour on alcohol, with a standard deviation of $5. I jokingly ask whether or not graduate students from Brooklyn earn a different wage than grad students in general. I gather together 9 graduate students from this program and calculate the average amount they earn an hour: $11.00. Use an alpha level of .01. How do I know I need to be using a z-test? 1. We are comparing a sample mean to a KNOWN population mean. 2. We KNOW the population s.
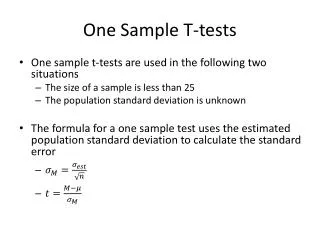
Use the best estimate of sx You must correct for the uncertainty of this estimate. t-score for a single sample mean x - mx tobt = sx What to do if you do not know the Population Standard Deviation (s)? s Where s = _ x
What to do if you do not know the Population Standard Deviation (s)? _ _ x x
Hypothesis testing with the t-statistic Probability Retain H0 Reject H0 Outcome “t” t-crit One-tailed test
One-Sample t-test z-test is used when we know both m and s t-test is when we know m but not s
The Sampling Distribution of the t-test This table lists the critical value of the t-statistic for the Degrees of freedom and a level. Given the level and the df you can find the critical value of the t-statistic that divides the outcomes into reject or retain the null.
The average IQ score of Americans is 100. I believe that my Statistics class (you guys!) have different IQs than the general population. I force all 15 of you to take an IQ test, and I calculate a mean of 110 (s= 20). Use an alpha level of .05 to determine if this class has a different IQ than the population. How do I know I need to be using a one-sample t-test? Step 1: State the null and alternative hypotheses: H0: My stats class does not have a different IQ than the average American H1: My stats class has a different IQ than the average American Step 2: Find the critical value. Go to t-table! Must figure out of this is one- or two-tailed, and df.
The Sampling Distribution of the t-test This table lists the critical value of the t-statistic for the Degrees of freedom and a level. Given the level and the df you can find the critical value of the t-statistic that divides the outcomes into reject or retain the null.
The average IQ score of Americans is 100. I believe that my Statistics class (you guys!) have different IQs than the general population. I force all 15 of you to take an IQ test, and I calculate a mean of 110 (s= 20). Use an alpha level of .05 to determine if this class has a different IQ than the population. How do I know I need to be using a one-sample t-test? Step 1: State the null and alternative hypotheses: H0: My stats class does not have a different IQ than the average American H1: My stats class has a different IQ than the average American Step 2: Find the critical value. Go to t-table! Must figure out of this is one- or two-tailed, and df. +/-2.145
The average IQ score of Americans is 100. I believe that my Statistics class (you guys!) have different IQs than the general population. I force all 15 of you to take an IQ test, and I calculate a mean of 110 (s= 20). Use an alpha level of .05 to determine if this class has a different IQ than the population. Step 3: Calculate the obtained statistic: - 110 100 ________ = = 10/5.17 = 1.93 20/sqrt(15) Step 4: Make a decision. I I Step 4: Retain the null hypothesis. -2.15 2.15
The Sampling Distribution of the t-test This table lists the critical value of the t-statistic for the Degrees of freedom and a level. Given the level and the df you can find the critical value of the t-statistic that divides the outcomes into reject or retain the null.
How can we know when two samples are different? Random Samples Different population, different statistical character Same population, same statistical character Type II error occurs when we conclude items from different populations are the same. Type I error occurs when we conclude items from the same population are different.