Understanding Graphic Variables in Thematic Maps: Essentials for Digital Cartography
220 likes | 332 Vues
This lecture focuses on graphic variables essential for creating effective thematic maps in digital cartography. It explores concepts such as size, shape, color, hue, saturation, and texture, and their impact on visual perception and data representation. The discussion builds on Bertin's typology of graphic variables, emphasizing the importance of visual logic and contrast. Key elements include how arrangements and orientations of symbols contribute to understanding spatial relationships, the role of numerical levels of measurement, and the nuances of color schemes in conveying data messages effectively.

Understanding Graphic Variables in Thematic Maps: Essentials for Digital Cartography
E N D
Presentation Transcript
Geog 462: Lecture 4 GRAPHIC VARIABLES: SYMBOLS FOR THEMATIC MAPS
GRAPHIC VARIABLES • Exploration - Presentation Continuum • Visual Logic / Visual Contrast • Noticing the unexpected / Conveying the message • Building on Bertin’s typology of graphic variables • Fundamental units - building blocks Geog 462: Digital Cartography
Size Value Hue Saturation Orientation Shape Arrangement Texture Focus Graphic Variables Geog 462: Digital Cartography
Location in Space • Numerical Level of Measurement • Position in the plane • 2D / 3D • Distance • Scale - Ratio Level • Relative - Ordinal Level (Fig 2.05) • Stereo Model for 3D - holographic images Geog 462: Digital Cartography
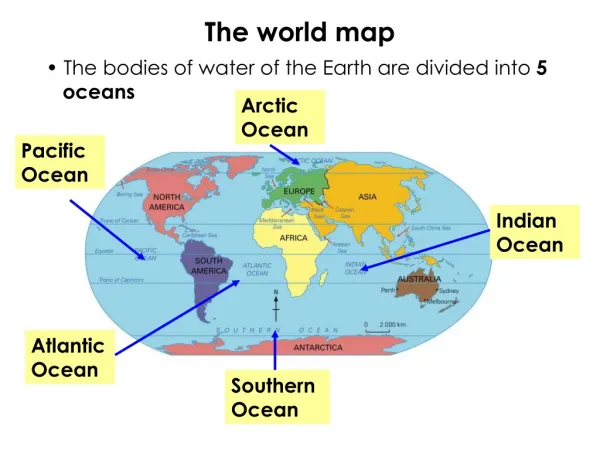
Effects of various map projections Bering Strait? Antarctica? South America to Australasia? (See also Fig 2.06) Geog 462: Digital Cartography
SIZE and SHAPE • SIZE • Ordinal level - change symbol size • Easily distinguished by eye • Small, Medium, Large • Low, Moderate, High • SHAPE • Nominal level - different kinds of things • Human vision not sensitive to small shapes • ‘Reading’ versus ‘Seeing’ maps Geog 462: Digital Cartography
Uses and Abuses of Size and Shape MacEachren Figs 2.07 to 2.11 p. 21
COLOR VALUE • Variation in lightness or darkness • High values light (white, yellow) • Low values dark (navy blue, black) • % Black [0% - 100%] • Human perception of brightness does not correspond in linear way with measured reflectance • Value has order - ordinal data • Quantitative - Magnitudes of values • BUT human vision does not distinguish between many gray tones Geog 462: Digital Cartography
COLOR HUE • Red, blue , green sensation • Measure of wavelengths that surface reflects or emits • Electromagnetic spectrum • Hue differences and representation of ordered or numerical data • No everyone knows the order • Hue values overwhelm perception Geog 462: Digital Cartography
Pattern Variation resulting from different color schemes of data in A) B) Value Range C) Spectrally ordered Hue D) Hue range ordered by Value MacEachren Fig 2.14 C p.24 and plates
Combining Hue and Value: The highest Value hue of the spectrum (Yellow) occupies the middle of the range. Hues decrease in value in both directions. A) Yellow through green to blue or violet B) Yellow through orange to red (MacEachren 1994 p. 25)
Color Saturation • Purity of the Hue • Defined only in color context • Obvious visual order • The range of wavelengths reflected / emitted from a specific location on the map • Narrow range - Pure hue • Wide range - impure or muddy color Geog 462: Digital Cartography
Color Schemes a) Unordered Hue b) Two Hue Progression c) Spectral Hues d) Hue-Value Series e) PMS-Value Series f) B&W Value Series See Mersey (1990) for the experiment and results
Sequential Color Schemes SAME HUE A) Lightness varies (color value) B) Lightness and Saturation Vary DIFFERING HUES A) Portion of Color Circle B) Entire Color Circle
Graphic Variables cont. • Texture • Spatial frequency of pattern components • Human vision highly sensitive to texture • Large area to be readily visible • Depth perception • Coarse texture nearer viewer, fine texture father away • VISUAL SEPARATION Geog 462: Digital Cartography
Graphic Variables cont • Arrangement • random / regular • Different kinds of things without implying importance • Combine with value for clearer distinction • Orientation • Human vision sensitive • Focus Geog 462: Digital Cartography
POINTS TO REMEMBER • MAPS REFER TO A REALITY (Usually) • BUILDING BLOCKS FOR REPRESENTATION • Spatial Dimension • Level of Measurement • Visual Variables • CHOOSING THE APPROPRIATE DATA MODEL FOR THE REALITY, • or the phenomenon you wish to depict Geog 462: Digital Cartography