Download
1 / 39
400 likes | 543 Vues
AIR QUALITY REGULATIONS: Part II. Clean Air Acts Amendments of 1990. The Clean Air Act Amendments of 1990 are divided into 11 sections: TITLE I - Attainment of National Ambient Air Quality Standards TITLE II - Mobile Sources TITLE III - Air Toxics TITLE IV - Acid Deposition

E N D
Clean Air Acts Amendments of 1990 The Clean Air Act Amendments of 1990 are divided into 11 sections: TITLE I - Attainment of National Ambient Air Quality Standards TITLE II - Mobile Sources TITLE III - Air Toxics TITLE IV - Acid Deposition TITLE V - Permit Provisions TITLE VI - Ozone Depleting Chemicals TITLE VII - Enforcement TITLE VIII - Miscellaneous TITLE IX - Clean Air Research TITLE X - Disadvantaged Business Concerns TITLE XI - Clean Air Employment Transition Assistance
TITLE I-Attainment National Ambient Air Quality Standards • Draw the boundaries of non attainment areas for carbon monoxide (CO), Ozone (O3), and particulate matter (PM) • Ozone (O3) • Severe • Serious • Moderate • Marginal • Extreme for LA • Carbon monoxide (CO), and Particulate Matter (PM -10) • Serious • Moderate • Definition of a “Major Source” • Extreme Areas : 10 tons of VOC and NOx per year • Severe Areas: 25 tons. • Serious : 50 tons. • Moderate and Marginal : 100 tons.19
TITLE II - Mobile Sources • Tier I • NOx : 0.6 grams / mile (1994) • HC : 0.4 grams / mile Auto : 100,000 or 10 years • Light Duty Trucks : 75,000 or 7 years • CO : 10 grams / mile • Tier II • NOx : 0.200 grams / mile (2003) • HC : 0.125 grams / mile • CO : 9.000 ppm (1996) (8hr concetration) • 1995 : Use of formulated gasoline in 9 cities
TITLE III - Air Toxics • 189 Air Toxics • List of Source Categories • 10 tons annual (Single Toxic) • 25 tons annual (Combination) • Maximum Available Control Technology Standard • Study Mercury Emissions from Utilities • Study Toxic Deposition in the Great Lakes • Requirement for Operating Permit
TITLE IV - Acid Deposition • Phase I • 111 Power Plants • Cut Back to the 2.5 lbs of SO2 per million BTU • Jan.1, 1995 • Phase II • Jan.1, 2000 • 1.2 lbs of SO2 per million BTU • EPA is required to issue rules for NOx • 10 million ton cut : SO2 • 2 million ton cut : NOx
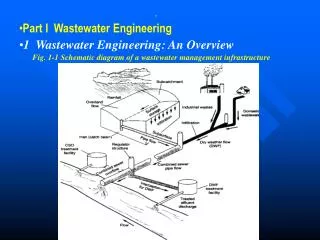
TITLE IV - Acid Deposition Trends in NOx emissions under the Acid Rain Program Trends in SO2 emissions since 1980 for all Title IV affected sources
TITLE V - Permit Provisions • 12 months to issue final rule • 3 years to implement permit program for states • EPA can veto a state's permit • Major Source : 5 year permit
TITLE VI - Ozone Depleting Chemicals • Phase-out of Ozone-depleting chemicals • CFC's, Halons, and Carbon Tetrachloride (2000) • Methyl Chloroform (2002) • HCFC's (2030) : Production cap by 2015
TITLE VII - Enforcement • Civil and criminal liabilities • 15 years in prison for knowingly endangering public • On-the-spot citations of upto $5,000 • Penalty orders upto $200,000 • Issue compliance orders • Issue compliance schedules • Issue administrative subpoenas to gather compliance data • Private citizens and groups to seek penalties against violators
Impact of CAAA of 1990 • 400 new regulations • Small businesses are hit hard • Coal miners in Midwest • Issue of new permits • Emission fee • Pollution control for 189 • Air toxics $26 Billion / Year by 2005 • Emission allowance and training program
National Ambient Air Quality Standards for Air Toxics • None developed by EPA. • Guideline for state. • Use of TLV- TWA (ACGIH). • Use of PEL (OSHA). • Use of IDLH (NIOSH). • Risk of 10-6 for carcinogenic pollutants. • etc.
Air pollution control alternatives • Emission Trading • Emission offsets policy • Bubble policy • Banking of emission offset credits • Netting policy
Emission Trading • Definition: An administrative approach to control pollution by providing economic incentives for achieving reductions in the emission of pollutants. • A governmental body sets a limit or cap on the amount of pollutant that can be emitted. • Companies that need to increase their emission allowance (credit) must buy credits from those who emit less. • Transfer of allowance is referred as “TRADE”.
Active Emission Trading programs: • United states: • SO2 trading system (1990 CAA) • VOC trading program in Illinois (1997) • CO2 cap-and-trade in New York (2003) • European Union Emission Trading Scheme (EU ETS): • Greenhouse gases (established in 2005) • New South Wales (Australia) • Greenhouse gas abatement scheme (established in 2003) • Carbon trading scheme (effective 2011) • New Zealand Emissions Trading Scheme: • Greenhouse gases (established in 2008) Note: The price of credits would be determined by global market demand and supply conditions.
Emission Offsets • Offset policy is for new sources • The new source needs to satisfy lowest achievable emission rate • All the existing sources, controlled by the same owner, need to be in compliance with emission standards • Emission reduction for existing sources can benefit the new source
Emission Offsets in The US • SO2 emissions were reduced by 43% from 1980 levels by 2007. • New York state’s Regional Greenhouse Gas initiative program aims to reduce the carbon "budget" of each state's electricity generation sector to 10% below their 2009 allowances by 2018. • Oregon has set CO2 emissions standard for new energy utilities. Price cap: $0.57/tCO2. Utilities can offset emissions using project based mechanisms. • In Washington, new plants must demonstrate the use of best available techniques for CO2 emissions control.
Emission Offsets • Massachusetts has also set CO2 emissions cap for energy utilities. Utilities can offset excess emissions using project-based mechanisms. • In Australia, since 2007, it is expected to annually reduce GHG emissions by more than 1.8 metric tones of CO2e.
Who is Buying? In percent of volume purchased since Jan.03 – Jan.08 Australia & New USA Canada Zealand Carbon Market 3% 3% 3% Other EU CFB 3% 24% Netherlands 23% Japan 41%
Who is Selling? In percent of volume sold from 2003 to May 2004 OECD Carbon Market 10% Transition Economies Latin America 27% 8% Africa 4% Asia 51%
Bubble Policy • Consider entire factory as a source by placing an imaginary “bubble” around the factory. • Set a standard for this entire source. • Industry can adjust the emissions of each individual stack. • Some can emit more than others as long as the entire source can comply with the bubble policy.
Banking of Emission Offset Credits • Banking emissions is a way of reserving emission reduction credit. • Incentive to shutdown, curtail operations, or install additional emission controls. • If an existing source is retired and new source is not installed immediately, it can “bank” the reduced emissions caused by source removal. • Credits for future use.
Netting Policy • Netting allows plants that are being modified or extended to be exempt from New Source Performance Standards, as long as the plant wide emission increase is not significant.
Air Pollution Strategies • Concept of " best practicable technology ". • Requirements • Environmental Need • Demonstrated Technological and Commercial Feasibility • Energy Efficient • Acceptance Of Overall Project Economics
International Standards Organization (ISO)14000 • Voluntary environmental standard designed to cover: • Environmental management systems • Environmental auditing • Environmental performance evaluation • Environmental labeling • Life-cycle assessment • Environmental aspects in product standards
References • D.Y.C. Leung, Daniel Yung, Amanda Ng, M.K.H. Leung, and Alan Chan, “An overview of emissions trading and its prospects in Hong Kong”, 2008. • K. Wark, C.F. Warner, and W. T. Davis, “Air pollution its origin and control”, Addison-Wesley, California, 1998