Download
1 / 10
100 likes | 218 Vues
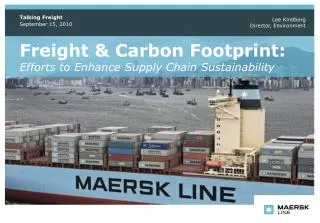
Supplemental Materials Carbon Footprint of Supply Chain Transportation and Shipping. Stanford Supply Chain Conference, 22 April 2008 Lee Kindberg Director, Environment MAERSK INC. 6000 Carnegie Boulevard, Charlotte NC 28209-4637 tel: (704) 571-2693 E-mail: NAMENVIRO@maersk.com

E N D
Supplemental Materials Carbon Footprint of Supply Chain Transportation and Shipping Stanford Supply Chain Conference, 22 April 2008 Lee Kindberg Director, Environment MAERSK INC. 6000 Carnegie Boulevard, Charlotte NC 28209-4637 tel: (704) 571-2693 E-mail: NAMENVIRO@maersk.com For additional information, see: http://www.maersk.com/en www.maerskline.com http://www.maerskline.com/link/?page=brochure&path=/about_us/environment http://www.maerskline.com/link/?page=brochure&path=/about_us/environment/Carbon_footprint_calculator
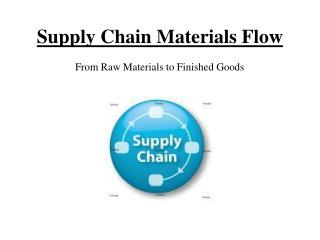
Drivers of Carbon Emissions and Reduction Potentials Part of supply chain Driver of emissions Ways to reduce emissions (examples) Ocean transportation • Volume moved • km covered • Higher container utilisation • Use of more eco-friendly carriers Air transportation • kg moved • km covered • Air to Sea-Air conversion Port moves • Number of containers • Higher container utilisation • 20’ to 40’ conversion • CFS-CY conversion Domestic distribution • Transportation mode (truck vs. rail) • km covered • Volume moved • Higher utilisation of delivery trucks/vans • Double-decker trailers • Increased use of rail • Use of bio-fuel • Number of days in warehouse • Number of CBM • Reduce safety stock • DC bypassing Warehousing
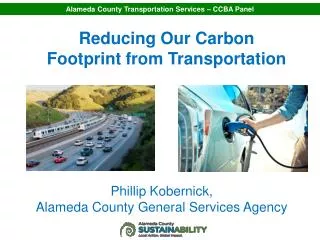
The Supply Chain and the Environment CO2 emissions can be reduced through • Understanding the sources of emissions • Choosing lower-impact modes and carriers • Marine carriers with more environmentally responsible vessels • Rail • Inland waterway transportation (barge) • SmartWay trucks • Increased supply chain efficiency Opportunity: reduce both CO2 emissions and costs
Clean Cargo Working Groupwww.bsr.org • Business-to-business forum “to promote sustainable product transportation.” • Environmental Performance Survey (EPS, done annually) • Intermodal calculator - now includes rail, truck • Social Responsibility Survey • Members: • Shippers: Coca-Cola, The Gap, IKEA, Nike, Nordstrom, Shell, Starbucks, Timberland, Wal-Mart, Cisco, Dell, Fiji Water • Carriers: APL, CMA-CGM, Cosco, Hanjin, Hapag-Lloyd, “K” Line, Maersk Line, Hyundai, MSC, NYK Line, OOCL, Wallenius Wilhelmsen, Yang Ming, • Others: Chiquita/Great White Fleet, UPS
Clean Cargo Working GroupEnvironmental Performance Survey (EPS) • Standardized method for calculating and reporting environmental factors for shipping • Basis: WRI GHG Protocol • Emissions factors calculated per container by route • Actual port-to-port, route distances • Fuel use for that route • Ship capacities for ships on that route that year • Environmental footprint # containers X distance traveled X emissions factor
Calculating the “Carbon Footprint” for ocean shipping CO2 Emissions = Distance x No. of TEU x Emission Factor g of CO2 = km x TEU x [g of CO2 / (TEU x km)] Emissions factor is weighted average of all ships on that particular route. Basis: Greenhouse Gas Protocol ‘Distance-based methodology’ for calculating CO2 emissions. http://www.ghgprotocol.org/DocRoot/7NmWvnZLTBdCB73po4tL/co2-mobile.pdf 1
Container Capacity • One 40-foot -- same dimensions as a city bus • Can hold: • 1,500 DVD players • 18,000 T-shirts • 90,000 lamb chops (what a four-person family would eat in 450 years) • 45-foot container -- 28,000 Barbie Dolls
Route and vessel do matter Rules of thumb: Larger vessels are more efficient, so use less fuel per container. Newer vessels are also generally designed to be more efficient.
CO2 Emissions by Mode of TransportationOcean shipping has the lowest environmental impact for long distance transportation. Air > 1,500 km(Boeing 747-400) 5,582 Truck(Global Average) 472 205 Rail diesel Rail electric(Global average) 176 Ocean(Avg. ML-owned vessels) 84 0 1,000 2,000 3,000 4,000 5,000 6,000 grams of CO2 emitted per (TEU.km)
What we’ve learned • Very important to use a consistent approach • Different models may give somewhat different • Know & understand the assumptions and numbers • Best if agreed-upon by whole industry • Data verification • Unit conversions • Distances • Cargo weights and types • Focus on improvements and incorporating CO2 into business decisions • Using route and mode emissions factors is time efficient • Greater accuracy is much less important than consistent measures and reduction quantity