Download
1 / 37
370 likes | 388 Vues
Learn about using internet map servers and remote sensing for educational purposes to enhance geographic literacy. This project aims to introduce teachers to GIS and oceanography through an interactive website and workshops.

E N D
USING AN INTERNET MAP SERVER AND COASTAL REMOTE SENSING FOR EDUCATION Peter A. Bower June 8th 2005
Overview • Introduction/Justification • Methods • Data Gathering/Processing • IMS Building • Teacher workshops • Results • IMS Build • Lessons written • Feedback • Discussion • Future Work
Introduction • Increasingly globalized society • Need for geographic literacy • More technology in daily lives • Keeping pace • Powerful Tools Available for geographic inquiry • Geographic Information Systems (GIS) • Remote Sensing (R/S) • Schools working to integrate technology • Science striving to engage public
Previous Findings • Kerski 2001 extensive study in adoption of GIS in High Schools • 2% in US have adopted • Those who have GIS 20% use more than once • Kerski others found barriers to GIS • Computing hardware/facilities • Time, time, time (prep/software instruction to Teach/Stu) • Data processing • Instructor training (educator geared) • Perceived software difficulty
Research Questions • Can an IMS site be used effectivelyto teach students at the high-school level about remote sensing, large-scale oceanography concepts, and biological interactions? • What are some of the impediments to successful implementation of an IMS and possible solutions?
Project Goals • Design an IMS Web site, the Oregon Coastal Marine Viewer (OCMV) using ocean remote sensing, and oceanography data that are user-friendly to teachers and students • Develop educational modules to complement the web site for SMILE activities
Project Goals • Introduce teachers to GIS, remote sensing, and oceanography and how to use the IMS site in a series of workshops: one in the summer to introduce ideas, and one in the winter to introduce the working OCMV site and specific IMS lessons, • Obtain feedback to improve the site and identify impediments to successful IMS integration.
Collaborators • CIOSS - Cooperative Institute for Oceanographic Satellite Studies • SMILE - Science & Math Investigative Learning Experience • Focus on students (mostly rural) who are underrepresented/underserved in math and science • Science and math enrichment activities at weekly after school club meeting to foster students interest in college studies
Data Used/Collection • Base Layer Data (State, Cities) • Sea Surface Temperature (SST) • Ocean Chlorophyll Concentration (Ocean Color) • Plankton Net Samples • Bird Observations • Mammal Observations
US GLOBEC Study Area Ship Track R/V Roger Revelle (August )
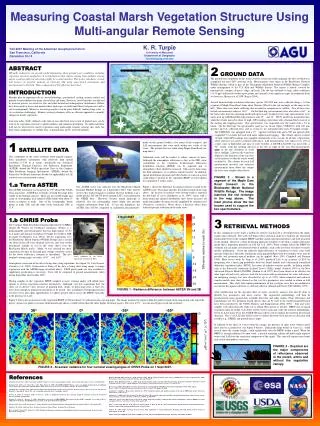
Advanced Very High Resolution Radiometer AVHRR Global Coverage of Sea Surface Temperature Images Raw data processed to an output grid values of 0-25.5o Cat 1.3 Km resolution obtained from US Globec NE Pacific Project Satellite Data Archive/ COAS
Sea-viewing Wide Field Sensor (SeaWiFS) 8-Day Composite Images Courtesy of Dr. Andrew Thomas, University of Maine, Satellite Oceanography Data Laboratory Chlorophyll concentration values collected in milligrams chlorophyll per cubic meter with a resolution of 4km
R/V New Horizon R/V New Horizon in Newport Oregon with plankton sampling net visible on stern waiting deployment
Plankton Sampling Net System MOCCNESS Multiple Opening/Closing Net and Environmental Sampling System Diagram US GLOBEC
Mammal and Bird Observation Data Collection R/V Roger Revelle, Scripps - UCSD 25 x 150 Binoculars 6 nautical mile range on clear days
Data Processing • Converted Binary SST images to TIFFs andGeoreferenced in ArcMap • Georeferenced SeaWiFS 8-Day Composite Images • Text File to Shapefile for • Plankton Net Tows • Bird Observations • Mammal Observations
Data Processing • Data Simplification • Large number of point data for two time periods early summer, later summer • Multiple data layers selected at the same time overwhelming to students teachers • Data subsets selected and new layers created • Data attribute tables large and confusing • Simplified Number of columns • Added common names for birds/mammals
Data Simplification An example of simplified bird data
IMS Basic Workflow • Client • Server • Web Server • Servlet engine • Spatial Server
IMS Site Construction • ArcIMS Author and Designer used for creation of basic Layout and Map Service • Manual File Editing to customize • Grid Display • Layout of web site customized from default • Layers/Legend • Buttons • Links • Color/Appearance
OCMV SST Layers June 13, 2000 August 2, 2000
Lessons • Progressive lessons constructed and presented to teachers at two SMILE teacher workshops • Mapping school and resolution R/S (SUMMER) • Intro to GIS/IMS navigation using SST/Ocean Color (Winter) • Using R/S imagery and biological data (Winter)
Feedback • Teachers difficult to get a hold of • Workshop positive/negative • Too much in 2 hours? (limited technology skills) • Though it was interesting • Problems with computer lab access • Map service down • School computer lab issue (Firewall?) • Lack of time with students
Feedback • Limited time spent by teachers • Fairly easy to navigate • After workshop (2 hours) Limited prep-time • Central computer with projector • Students seemed to understand material (Depth?...)
Feedback • Interested in using more lessons • Marine Science • Outdoor field course (mapping/resolution) • District technology integration • Marine Science and technology integration • A good activity for visual learners
Discussion • Exposed 150+ students to GIS Remote Sensing and Oceanography • Time for teacher education very short • Permanent site set up with lessons written assuming no workshop • Although perhaps not all students were able to use IMS now have some exposure and if interested could use own time (home, library)
Discussion • More data available for addition to IMS site • Other outreach activities more information on research cruises available for further study • Some barriers encountered similar to desktop GIS • Computer lab availability • Network/server issues • Teacher education time (much less required)
Next Steps • Fix a few • Add Links page for electronic Lessons for download and Credits page • Link to US GLOBEC web Outreach Material • Recent server stability/image serving issues?
Next Steps, Continued • Online link from the Oregon Coastal Atlas • Publish? The National Marine Science Educators publication, Currents: The Journal of Marine Education • Online publish? on the BRIDGE web page (maintained by NMSE) • Marine Advanced Technology Education (MATE) Center link
SMILE Challenge Mock Oil Spill Response Group Project
Thanks!!! • Dr. Dawn J. Wright • Dr. Laurence Becker • Dr. A. Jon Kimerling • Dr. Ted Strub, College of Oceanic and Atmospheric Sciences, OSU • Melissa Feldberg, SMILE/Oregon Sea Grant • Molly Phipps, SMILE/ COAS • Ryan Collay, SMILE • Dr. Andrew Thomas, University of Maine • Laura Gray, Forest Grove School District • Colin Cooper, OSU Geosciences • Mark Meyers, OSU Geosciences • Keldah Heldstrom, OSU Geosciences • Emily Larkin, OSU Geosciences • Corrine James, OSU • Parents, Grandparents, Brother • the Rogues of Davey Jones Locker, and my friends and fellow graduate students for helping me make the journey though the past two years. • NOAA NESDIS • Geosciences Office Staff • Laura Gray for her endless enthusiasm, patience, love, and support