Download
1 / 6
60 likes | 180 Vues
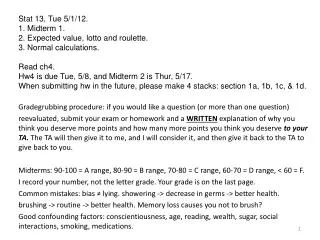
Stat 13, Tue 5/1/12. 1. Midterm 1. 2. Expected value, lotto and roulette. 3. Normal calculations. Read ch4. Hw4 is due Tue, 5/8, and Midterm 2 is Thur, 5/17. When submitting hw in the future, please make 4 stacks: section 1a, 1b, 1c, & 1d.

E N D
Stat 13, Tue 5/1/12. 1. Midterm 1. 2. Expected value, lotto and roulette. 3. Normal calculations. Read ch4. Hw4 is due Tue, 5/8, and Midterm 2 is Thur, 5/17. When submitting hw in the future, please make 4 stacks: section 1a, 1b, 1c, & 1d. Gradegrubbing procedure: if you would like a question (or more than one question) reevaluated, submit your exam or homework and a WRITTENexplanation of why you think you deserve more points and how many more points you think you deserve to your TA. The TA will then give it to me, and I will consider it, and then give it back to the TA to give back to you. Midterms: 90-100 = A range, 80-90 = B range, 70-80 = C range, 60-70 = D range, < 60 = F. I record your number, not the letter grade. Your grade is on the last page. Common mistakes: bias ≠ lying. showering -> decrease in germs -> better health. brushing -> routine -> better health. Memory loss causes you not to brush? Good confounding factors: conscientiousness, age, reading, wealth, sugar, social interactions, smoking, medications.
Be SILENT while I am passing out the exams or I will ask you to leave. Gradegrubbing procedure: if you would like a question (or more than one question) reevaluated, submit your exam or homework and a WRITTENexplanation of why you think you deserve more points and how many more points you think you deserve to your TA. The TA will then give it to me, and I will consider it, and then give it back to the TA to give back to you. Midterms: 90-100 = A range, 80-90 = B range, 70-80 = C range, 60-70 = D range, < 60 = F. I record your number, not the letter grade. Your grade is on the last page. Common mistakes: bias ≠ lying. showering -> decrease in germs -> better health. brushing -> routine -> better health. Memory loss causes you not to brush? Good confounding factors: conscientiousness, age, reading, wealth, sugar, social interactions, smoking, medications.
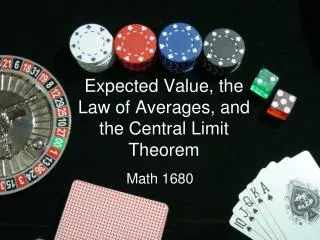
2) Expected value, lotto and roulette. If a random variable X has certain values yi it can take with certain known probabilities pi, then its Expected value, E(X) = ∑i yipi. For example, take the Lotto 6/52. What’s the probability of winning? Imagine listing your 6 numbers. We want P(1st ball on list AND 2nd ball is on list AND . . .AND 6th is on list). These are NOT independent! Why not? P(2nd is on list) = 6/52. But P(2nd is on list|1st is on list) = 5/51. So we want P(1st ball on list) P(2nd ball is on list | 1st is on list) ... P(6th is on list | 1st – 5th are on list) = 6/52 5/51 4/50 3/49 2/48 1/47 = 1/20, 358, 522. If the ticket is worth $10 million with prob. 1/20million, or $0 with prob. 1- 1/20million, then the expected value is ($10 million x 1/20million) + ($0 x [1-1/20million]) = $0.50. This is a fair price for this ticket, i.e. the longterm average value of a ticket. We say a game is “fair” if the expected profit is zero. In roullette, if you bet on one number: E(profit) = ($35 x 1/38) + ($-1 x 37/38) = $-2/38 = $-.053. You lose 5.3 cents per dollar wagered, on average. Red/black? Exp. profit = ($1 x 18/38) + ($-1 x 20/38) = $-2/38 = $-.053.
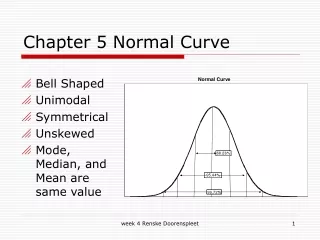
3. Normal calculations. The normal curve comes up a lot in applications. Sometimes it is useful to summarize the shape of a distribution by saying it is approximately like the normal curve, and then just knowing that information, along with the mean and standard deviation, one can estimate what proportion of the sample falls into some range. N(10,22). Some properties of the normal curve: a) symmetric around the mean, µ. b) ~ 68% of the area under the curve is within 1 sd of µ. c) ~ 95% of the area under the curve is within 2 sds of µ. So for instance , say you know the distribution of some variable is approximately normal with mean µ = 5 and standard deviation s = 20. (variance 202.) We call this N(5, 20). To standardize it, subtract µ and divide by s. Say you’re asked to find a range in which the middle 95% of the values fall, you’d say 5 ± (2 x 20) = 5 ± 40 = (−35, 45). The STANDARD normal curve is the particular case where µ = 0 and s = 1. N(0, 1). From the standard normal, you can find out anything about the normal curve. For instance, suppose IQ scores are normally distributed with mean 100 and sd 15. What’s the probability that a randomly selected score is greater than 106.6? Remember: AREA = PROBABILITY!
IQ scores are normally distributed with mean 100 and sd 15. What’s the probability that a randomly selected score is greater than 106.6? Remember: AREA = PROBABILITY! So, answer is the area to the right of 106.6 for the normal curve with mean 100 & sd 15. Convert this to a question about the std normal, by subtracting the mean and dividing by the standard deviation. Area to right of 106.6 for N(100, 15) = the area to right of 6.6 for N(0, 15) = the area to right of 0.44 for N(0, 1). So to answer the question all we need to know is the area to the right of 0.44 for std. normal curve! Easy: it’s in the tables. 33%. Two ways to get this. a) Find 0.44 in the table. Get 0.67. So that’s the area to LEFT of 0.44. So area to right of 0.44 is 1 − 0.67 = 0.33. b) Find −0.44 in the table. Get 0.33. So that’s the area to left of −0.44 for std normal. But since the std normal is symmetric around 0, this is the same as the area to the right of 0.44.
Another example. Suppose that, according to a 2011 National Health Statistics Report, adult diastolic blood pressures are ~ normally distributed with mean 71 and sd 27. What fraction of people have a pressure < 102? Sounds like a statement about many people. But it’s the same as P(ONE randomly selected person has a pressure < 102) = the area under normal curve to the left of 102 = area under std. normal curve to left of (102 − 71)/27 ~ 1.15. Which is 0.8749 from the table. So the answer is 87.49%. What fraction have pressures between 97 and 102? This is the area under the std normal curve between (97−71)/27 and (102-71)/27, i.e. between 0.96 and 1.15, which is the area to left of 1.15 minus the area to left of 0.96 = 0.8749 − 0.8315 = 0.0434, or 4.34%.