Download
1 / 24
280 likes | 842 Vues
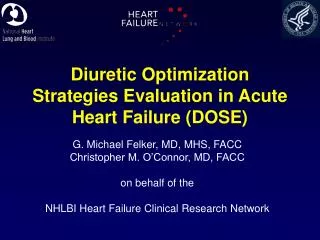
Diuretic Optimization Strategies Evaluation in Acute Heart Failure (DOSE). G. Michael Felker, MD, MHS, FACC Christopher M. O’Connor, MD, FACC on behalf of the NHLBI Heart Failure Clinical Research Network. Study Organization. Study Chair: Eugene Braunwald, MD

E N D
Diuretic Optimization Strategies Evaluation in Acute Heart Failure (DOSE) G. Michael Felker, MD, MHS, FACC Christopher M. O’Connor, MD, FACC on behalf of the NHLBI Heart Failure Clinical Research Network
Study Organization Study Chair: Eugene Braunwald, MD Regional Clinical Centers: David Bull, MD, Anita Deswal, MD, Steven Goldsmith, MD, Martin LeWinter, MD, Christopher O’Connor, MD, Elizabeth Ofili, MD, Margaret Redfield, MD, Jean Rouleau, MD, Lynne Stevenson, MD, Bradley Bart, MD, Horng Chen, MD, Michael Felker, MD, Michael Givertz, MD, Marc Semigran, MD, Josef Stehlik, MD Data Coordinating Center: Duke Clinical Research Institute Kerry Lee, PhD, Kevin Anstrom, PhD, Eric Velazquez, MD, Adrian Hernandez, MD, Steven McNulty, MS Biomarkers Core Laboratory: Russell Tracy, PhD NHLBI: Alice Mascette, MD (Project Officer), Julianna Keleti, PhD, Robin Boineau, MD, Monica Shah, MD, Patrice Desvigne-Nickens, MD, George Sopko, MD Funding Source: National Heart, Lung and Blood Institute
Background • IV loop diuretics are the most commonly prescribed therapy for acute decompensated heart failure • Few prospective studies exist to guide practice, resulting in substantial variation in route of administration and dosing • Observational data suggest that higher diuretic doses may be associated with risk of worsening renal function, heart failure progression, or death1 • Cochrane collaboration systematic review suggests continuous infusion may be superior to intermittent bolus dosing2 1. Felker, GM et al. Circulation: Heart Failure, 2009 2. Salvator, DR. Cochrane Database, 2005
Aims • To evaluate the safety and efficacy of various initial strategies of furosemide therapy in patients with ADHF • Route of administration: • Q12 hours bolus • Continuous infusion • Dosing • Low intensification (1 x oral dose) • High intensification (2.5 x oral dose)
Study Design Acute Heart Failure (1 symptom AND 1 sign) <24 hours after admission 2x2 factorial randomization Low Dose (1 x oral) Q12 IV bolus Low Dose (1 x oral) Continuous infusion High Dose (2.5 x oral) Q12 IV bolus High Dose (2.5 x oral) Continuous infusion 48 hours 1) Change to oral diuretics 2) continue current strategy 3) 50% increase in dose 72 hours Co-primary endpoints 60 days Clinical endpoints
Co-Primary Endpoints • Efficacy: • Patient Global Assessment by visual analog scale over 72 hours using area under the curve • Safety: • Change in creatinine from baseline to 72 hours
Visual Analog Scale Area Under the Curve VAS assessed at 6, 12, 24, 48, 72 hours
Secondary Endpoints • Change in weight over 24, 48, 72, 96 hours • Freedom from signs and symptoms of congestion at 72 hours • Bivariate vector of change in creatinine and weight at 72 hours • Dyspnea VAS AUC over 24, 48 and 72 hours • Change in serum creatinine at 24, 48, 96 hrs, day 7 (or discharge), and day 60 • Change in cystatin C at 72 hours, day 7 (or discharge) and day 60 • Persistent or worsening heart failure • Development of worsening renal function (increase in Cr > 0.3 mg/dL at any time during initial 72 hours) • Treatment failure (persistent heart failure, worsening renal failure, or death) • Index hospitalization length of stay • Death, rehospitalization, or ED visit within 60 days
Inclusion-Exclusion Criteria Inclusion • ≥18 years old • Prior clinical diagnosis of heart failure with daily home use of oral loop diuretic for at least one month • Daily oral dose of furosemide ≥ 80 mg and ≤240 mg (or equivalent) • Identified within 24 hours of hospital admission • Heart failure defined by at least 1 symptom and 1 sign • Anticipated need for IV loop diuretics for at least 48 hours • Willingness to provide informed consent Exclusion • Received or planned IV vasoactive treatment (inotropes, vasodilators) or ultra-filtration therapy for heart failure • Systolic BP <90 mmHg • Serum creatinine >3.0 mg/dl at baseline or renal replacement therapy • BNP < 250 ng/ml or NT-proBNP <1000 mg/ml (if measured for clinical purposes) • Acute coronary syndrome within 4 weeks • Anticipated need for coronary angiography or other procedures requiring IV contrast
Statistical Methods • Target sample size: 300 patients • 88% power for detecting creatinine difference of 0.2 mg/dL • 88% power for a 600 point difference in VAS AUC • 1:1:1:1 permuted block randomization, stratified by clinical site • Treatment comparisons by “intention to treat” • Statistical significance: p<0.025 for the two primary endpoints, p<0.05 for secondary endpoints • Each treatment factor (route and intensity) compared using general linear model (continuous endpoints), logistic regression (binary endpoints), Cox model and Kaplan-Meier curves (event-time endpoints)
Patient Global Assessment VAS AUC:Q12 vs. Continuous Q12 Continuous Q12 VAS AUC, mean (SD)= 4236 (1440) Continuous VAS AUC, mean (SD)= 4373 (1404) P = 0.47 Pt Global Assessment by VAS Hours
Patient Global Assessment VAS AUC:Low vs. High Intensification Low High Low VAS AUC, mean (SD)= 4171 (1436) High VAS AUC, mean (SD)= 4430 (1401) P = 0.06 Pt Global Assessment by VAS Hours
Change in Creatinine at 72 hours 0.15 p = 0.45 p = 0.21 0.1 0.08 0.07 Change in Creatinine (mg/dL) 0.05 0.05 0.04 0 Q12 Continuous Low High
Low High Changes in Renal Function over Time:Low vs. High Intensification Creatinine Cystatin C Change in Creatinine (mg/dL) Change in Cystatin C (pg/dL) Days Days P > 0.05 for all timepoints
Proportion with Worsening Renal Function*:Low vs. High Intensification P > 0.05 for all timepoints % with Δ Cr > 0.3 mg/dL Days *Based on local lab creatinine values
Death, Rehospitalization, or ED Visit HR for Continuous vs. Q12 = 1.19 95% CI 0.86, 1.66, p = 0.30 HR for High vs. Low = 0.83 95% CI 0.60, 1.16, p = 0.28
Limitations • DOSE evaluated only patients with a history of chronic heart failure and moderate to high diuretic requirements • DOSE had limited power to detect differences in clinical events • DOSE protocol allowed changes in therapy at 48 hours based on clinical response, which may have minimized observed differences between groups
Conclusions • There was no statistically significant difference in global symptom relief or change in renal function at 72 hours for either: • Q12 bolus vs. Continuous infusion • Low intensification vs. High intensification
Conclusions (2) • There was no evidence of benefit for continuous infusion compared to Q12 hour bolus on any secondary endpoint • Despite transient changes in renal function, there was no evidence for higher risk of clinical events at 60 days associated with the high intensification strategy • High intensification (2.5 x oral dose) was associated with trends towards greater improvement in multiple domains: • Symptom relief (global assessment and dyspnea) • Weight loss and net volume loss • Proportion free from signs of congestion • Reduction in NT-proBNP
Baylor Duke Harvard Mayo Clinic Minnesota Montreal Morehouse Utah Vermont NHLBI Heart Failure Clinical Research Network