Analysis of Helper Distribution Across Generations in Population Mutations
This study investigates the number of patches containing a single helper across different mutation generations. The figures represent complex interactions, local distributions, and the impact of mutations on helper encounters. Specifically, we explore the dynamics of helper populations, their local encounters, and how these factors influence genetic variability and community structure. Our analysis sheds light on the evolutionary implications of these interactions, offering insights into the robustness and adaptability of the helper population in response to environmental changes.

Analysis of Helper Distribution Across Generations in Population Mutations
E N D
Presentation Transcript
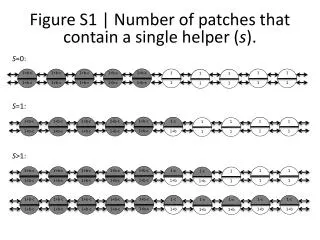
Figure S1 | Number of patches that contain a single helper (s). 1 1+b-c 1+b 1-c 1+b-c 1+b-c 1+b-c 1 1+b-c 1 1 1 1+b-c 1+b-c 1+b-c 1+b-c 1 1 1 1 1 1+b-c 1 1 1+b-c 1+b-c 1+b-c 1+b-c 1 1 1+b-c 1 1+b-c 1+b-c 1+b-c 1+b-c 1 1 1 1+b-c 1+b-c 1 1-c 1+b-c 1+b-c 1+b-c 1+b-c 1+b 1-c 1 1 1+b-c 1+b-c 1+b-c 1+b-c 1 1 1 1+b-c 1+b-c 1+b-c 1-c 1+b 1-c 1+b-c 1+b-c 1+b-c 1+b-c 1+b 1-c 1+b 1-c 1+b-c 1+b-c 1+b-c 1+b-c 1+b 1-c 1+b 1+b S=0: S=1: S>1:
Figure S2 | Further mutational input in the population. 1+b 1-c 1+b-c 1+b-c 1+b-c 1+b-c 1+b-c 1+b-c 1+b-c 1+b-c 1+b-c 1+b-c 1+b-c 1+b-c 1+b-c 1+b-c 1+b-c 1+b-c 1+b-c 1+b-c 1+b-c 1+b-c 1+b-c 1+b-c 1+b-c 1+b-c 1+b-c 1+b-c 1+b-c 1+b-c 1+b-c 1+b-c 1+b-c 1+b-c 1+b-c 1+b-c 1+b-c 1+b-c 1+b-c 1+b 1-c 1+b 1-c 1+b 1+b-c 1-c 1+b-c 1+b-c 1+b-c 1+b-c 1+b-c 1+b-c 1+b-c 1+b-c 1+b-c 1+b-c 1+b-c 1+b-c 1+b-c 1+b-c Generation 0: Mutation Generation 1: Generation 1+t:
Figure S3 | Local distributions of helpers encounter others. 1-c 1+b-c 1+b-c 1+b-c 1+b-c 1+b-c 1+b-c 1+b-c 1+b-c 1+b-c 1+b-c 1+b-c 1+b-c 1+b-c 1+b-c 1+b-c 1+b-c 1+b 1+b-c 1+b-c 1+b-c 1+b-c 1+b-c 1+b-c 1+b-c 1+b-c 1+b-c 1+b-c 1+b-c 1+b-c 1+b-c 1+b-c 1+b-c 1+b-c 1+b-c 1+b-c 1+b-c 1+b-c 1+b-c 1+b-c Generation 0: Replacement by neighbour Generation 1: