Download
1 / 39
390 likes | 504 Vues
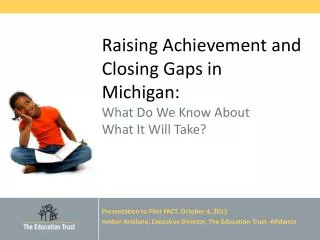
The Achievement Gap Initiative At Harvard University. Cultivating Leadership For Closing Achievement Gaps & Some Reasons for Cautious Optimism Ronald F. Ferguson, PhD Faculty Co-Chair & Director the Achievement Gap Initiative at Harvard University,

E N D
The Achievement Gap Initiative At Harvard University Cultivating Leadership For Closing Achievement Gaps & Some Reasons for Cautious Optimism Ronald F. Ferguson, PhD Faculty Co-Chair & Director the Achievement Gap Initiative at Harvard University, & Creator and Director of the Tripod Project for School Improvement Leadership for Excellence and Equity for All Annual Conference DuPage County Regional Office of Education January 15, 2008 To Contact the AGI, Email: AGI@Harvard.edu, 617-496-9154 Web Addresses: www.AGI.Harvard.eduand www.tripodproject.org
There is an urgent need for: • Youth cultures that more consistently support behaviors consistent with academic learning and the pursuit of excellence; • Parenting that nurtures intellectual growth and balances warmth and responsiveness with structure and demandingness; • Teaching that engages and challenges students; • Community supports to supplement parents and teachers; • Leadership to organize, guide and motivate others in a 21st Century Social Movement for Excellence with Equity. Urgency AND Possibility.
Program for International Student Assessment, 15-Year Olds, 2003, Math Literacy in OECD Nations (Dark Blue = U.S. Students)
Program for International Student Assessment, 15-Year Olds, 2003, Math Problem Solving in OECD Nations (Dark Blue = U.S. Students)
“Any fool can count the seeds in an apple, but only God can count the apples in a seed.” Rev. Robert Schuller The bounty of the harvest depends upon the effectiveness of cultivation, and the effectiveness of cultivation depends, over time, on the intensity of the search for effective methods and the dedication of effort to help children reach their full potential.
Some Good News • Black-white and Hispanic-white test score gaps at the high school level for NAEP and SAT scores narrowed dramatically during the 1970s and 1980s, during a period when the gap in high school graduation rates also narrowed. • The black-white IQ gap narrowed by more than 25 percent between 1972 and 2002. • There are virtually no differences in mental ability by SES or race/ethnicity at 9-11 months of age in the National ECLS. Some More Bad News • At the end of the 1980s, black-white and Hispanic-white gaps for high school students abruptly stopped narrowing for NAEP scores, SAT scores and high school graduation rates.
Standardized NAEP scores for white 9, 13 and 17-year olds. (Distance below 17-year old whites' scores, as a fraction of white 17-Year olds' scores in 1996 1988 2004 1984 Reading 1980 1996 WHITES 2004 Age 17 1990 1986 Age 13 Math 1996 *Note: The horizontal axis is the approximate birth year. Age 9 1982
Standardized NAEP reading scores for Hispanic 9, 13 and 17-year olds. (Distance below 17-Year old whites' Scores, as a fraction of white 17-Year olds' scores in 1996 1990 2004 Age 17 Reading Age13 1996 Age 9 HISPANICS 2004 1992 Age 17 Math Age13 *Note: The horizontal axis is the approximate birth year. 1996 Age 9
Standardized NAEP scores for black 9, 13 and 17-year olds. (Distance below 17-year old whites' scores, as a fraction of white 17-Year olds' scores in 1996 1992 1988 2004 Age 17 1984 Reading Age 13 1988 1980 1996 Age 9 BLACKS 1990 2004 Age 17 Math 1986 Age 13 1996 *Note: The horizontal axis is the approximate birth year. 1982 Age 9
Nine-year olds’ NAEP reading and math for blacks and whites, by year aged 9. Reading Math
Gain in NAEP reading and math scores from ages 9 to 13, by the year the students were 13 years old.
Gains from ages 13 to 17 for synthetic cohorts, by year aged 17 Reading Math
Proportions of African American 12th Graders who Report that they Never Cut Class, by Major U.S. Census Region
Changes from 1984-1996 in black 17-year olds' mean NAEP reading scores, by region, and in the national percentage of black students who read daily or almost daily for pleasure
Conclusions Concerning Trends • Black-white and Hispanic-white gaps narrowed dramatically during the 1970s and 1980s, showing clearly that narrowing is possible. • Progress for black and Hispanic teenagers stopped abruptly at the end of the 1980s, with an apparent (and unexplained) shift in youth culture among black teens: leisure reading levels and class attendance both fell. • The birth cohort of black youth that was 13-years old in 1988 had the highest-ever NAEP reading scores as 13-year olds, but then extremely small reading gains by the time they were 17 in 1992. It may be just a coincidence, but 1988-92 was the commercial take-off period for hip-hop and rap music. • The first few years of the present century have shown higher scores and smaller racial gaps in the NAEP at 4th and 8th grades, but not at the high school level. • Finally, NAEP data from 1994 and 2002 show that remaining gaps among 12th graders are large at every level of parental education.
Leadership And Framing the Work
Percentages of teachers checking each listed statement, concerning “the last professional development program that had little or no effect on teaching or learning” in their classes.
Teacher engagement in professional development, such as addressed on the previous slides, is especially important when professional development might serve to expand instructional repertoires for topics that students find difficult to learn.
Acting White: Realities, Myths and Challenges
Source: Calculations by Ron Ferguson, using Tripod Project data for 6th to 12th graders collected spring 2005 from 17 secondary schools in NJ, CT, OH, NM, MA and CA.
Source: Calculations by Ron Ferguson, using Tripod Project data for 6th to 12th graders collected spring 2005 from 17 secondary schools in NJ, CT, OH, NM, MA and CA.
Why black high school students with “A”-range GPA’s agree somewhat more than black students with “C”-range GPA’s with the statement that, “At this school, students like me get accused of acting white.” Percentages of the predicted difference attributable to each listed factor.
Considering all black high school students, why some respond that people like themselves “usually” or “always” get accused of acting white, while others say “usually not” or “never.” Percentages attributable to each listed factor.
Percentages of black female high school students agreeing that it is at least somewhat true that, "I sometimes hold back from doing my best in this class, because of what others might say or think." Shown by GPA and by whether students responded "never" to the statement, "At this school, students like me get accused of acting white."
Percentages of black male high school students agreeing that it is at least somewhat true that, "I sometimes hold back from doing my best in this class, because of what others might say or think." Shown by GPA and by whether students responded "never" to the statement, "At this school, students like me get accused of acting white."
Youth Culture beyond Acting White • Who are black youth trying to be? • What gives them self esteem? i.e.,: • On the whole, I am satisfied with myself. • I feel that I am a person of worth, at least on an equal basis with others. • I take a positive attitude toward myself.
Self-Esteem, by GPA for black and white High School Students
Self-Esteem for male and female teenagers, related to whether rap or hip-hop music is “always” “usually,” “sometimes,” “usually not” or “never” “an important part of my life.” Source: Calculations by Ron Ferguson, using Tripod Project data for 6th to 12th graders collected spring 2005 from 17 secondary schools in NJ, CT, OH, NM, MA and CA.
Self-Esteem for male and female teenagers, related to whether rock music is “always” “usually,” “sometimes,” “usually not” or “never” “an important part of my life.” Source: Calculations by Ron Ferguson, using Tripod Project data for 6th to 12th graders collected spring 2005 from 17 secondary schools in NJ, CT, OH, NM, MA and CA.
Self-esteem, by GPA and by whether Hip-Hop music is “usually or always” “an important part of my life,” for black teenagers.
Racial and SES Differences in School Behavior
Percent responding, “somewhat true,” “mostly true,” or “totally true,” that, “My behavior is a problem for the teacher in this class.” Blacks Whites Mother’s Years of Schooling Male Female
Percent responding that at least sometimes, “People would probably describe my behavior style as ‘ghetto’.” Blacks Whites Mother’s Years of Schooling Male Female
Percentage who agree that at least sometimes, “Some teachers seem afraid of me,”