Download
1 / 50
500 likes | 632 Vues
King’s College, London 26 January 2010. SYSTEMIC RISK: DYNAMICS OF BANKING SYSTEMS Robert M May Zoology Department Oxford OX1 3PS, UK. OUTLINE. Stability & Complexity in Ecosystems and Financial Systems Dynamics of Networks – general – simple models

E N D
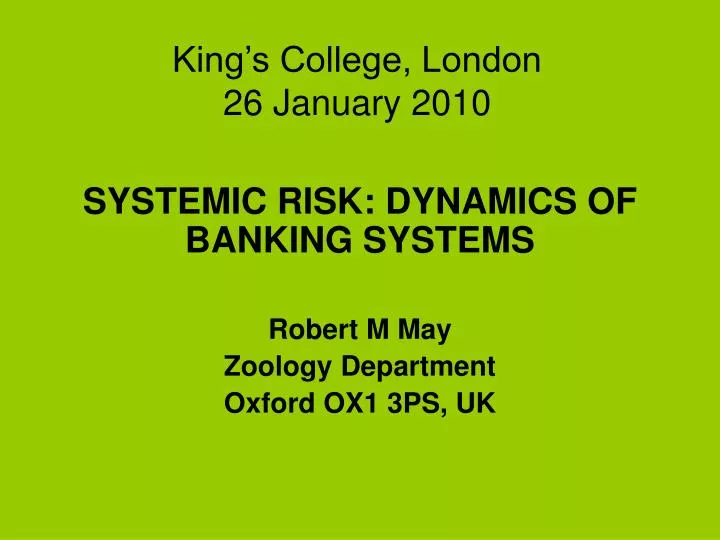
King’s College, London26 January 2010 SYSTEMIC RISK: DYNAMICS OF BANKING SYSTEMS Robert M May Zoology Department Oxford OX1 3PS, UK
OUTLINE • Stability & Complexity in Ecosystems and Financial Systems • Dynamics of Networks – general – simple models – a paradox • Implications – the scale of the problem – redesigning financial systems – redesigning safety nets
NETWORKS & INTERACTION STRENGTHS, A Consider a community of N species, each with intraspecific mechanisms which, in isolation, would stabilize perturbations. Now let there be a randomly constructed network of interactions among these N species (with a mean number, m, of links per species, and each interaction, independently randomly, being + or – and with average magnitude α compared with the intraspecific effects)
NETWORKS & INTERACTION STRENGTHS, B The overall stability of such a “randomly constructed” assembly explicitlydependsboth on the network’s connectance (number of links/number of possible links per species; C = m/N ), and on the average interaction strength α. For large N, the system is stable if, and only if, m α2 < 1
“ We present a simple model … [of banks; the model] leads to phase transition, which results in collective defaults. The existence of the collective phase depends on the mean interactive strength. …” Sieczka & Holyst, EPJ, B71, 461-466 (2009)
Arbitrage Pricing Theory (APT):1 “ In my view, derivatives are financial weapons of mass destruction, carrying dangers that, while now latent, are potentially lethal.” Warren Buffet (2002) APT enables you to give a present value to future risks, and thence to put prices on complicated “derivative” contracts.
APT: 2 APT draws from the mythological landscape of mathematical economics, assuming: • “perfect competition” • market liquidity • “no-arbitrage”, i.e. the nonlinear interplay between trading and the dynamics of financial markets can be ignored In good times, the expanding market is such that financial instruments indeed seemed to produce the “arbitrage-free” and “complete” market which APT hypothesizes
APT: 3 Eroding Market Stability by Proliferation of Financial Instruments, by Caccioli, Marsili & Vivo, EPJ, B71, 467-479 (2009) “The problem is that APT is not merely a theoretical description of a phenomenon, as other theories [in science]. It is the theory on which financial engineering is based. It enters into the functioning of the system it is describing, i.e. it is part of the problem itself.”
APT: 4 As Caccioli et al clearly show, using a deliberately simplified model (“ a caricature of markets”), although “the introduction of derivatives makes the market more efficient, competition between financial institutions naturally drives the market to a critical state characterized by a sharp singularity.”
APT: 5 Approaching the phase transition created by the usually-neglected dynamics of the system, Caccioli et al’s model shows a strong susceptibility to small perturbations, marked fluctuations in the underlying stock market, and strongly enhanced correlations across derivatives in these circumstances of stress (such correlations are negligible in “normal” times). cf. Scheffer et al, Early warning signals for critical transitions. Nature, 461, 53-59 (2009)
Schematic model for a ‘node’ in the interbank network SHOCK (to ei or li) (IN) Liabilities (OUT) Assets “Net worth”, γi Deposits di (1-θi)ai External assets ei j Interbank borrowing bi i Interbank loans li θiai
MODEL STRUCTURE & PARAMETERSIa: Assumptions as to what causes a bank to fail Initial default. A single bank loses a fraction, f, of its external assets: f(1-θ)ai. If all banks have the same value of ai , we can (without loss of generality) put ai=1 and thence the “first phase shock” is S(I) = f(1-θ) Furthermore, if the external asset holding itself is structured, such that each bank apportions its (1-θ) external assets equally among n “asset classes”, then we could assume the initial default to be caused by failure of a single asset class in a single bank: i.e. f = 1/n The bank is assumed to fail if S(I) > γi
MODEL STRUCTURE & PARAMETERSIb: Assumptions as to what causes a bank to fail Subsequent defaults. The initially failing bank will cause “phase II” shocks, S(II), to its j creditor banks. Two different assumptions can be made, representing opposite extremes: (1) Zero Recovery. If the initial bank fails, all its j creditor banks lose 100% of their loan to it (i.e. the failing banks assets go to zero). (2) Diminished Assets. The failing bank distributes its remaining assets, having lost f(1-θ) – γ of them. So the j creditors will experience a shock of S(II) = [f(1-θ) – γ] / j if this quantity is less than total borrowing (usually assumed equal to lending, θ), or S(II) = total borrowing (θ /j?) otherwise. And this is distributed to each of j connected banks, which in turn will fail if S(II) > γ . And so on, for Phase III and later shocks.
MODEL STRUCTURE & PARAMETERSIc: Assumptions as to what causes a bank to fail Note that zero recovery, (1), is a rather extreme assumption, but it makes for simpler calculations (with more banks failing!); failure propagates through interbank connections, rather like an infectious disease. The opposite extreme assumption (2) implies, in essentials, that the shocks in each subsequent phase (after the initial one bank failing) are attenuated, roughly by a factor 1/z (where z is the “mean degree” or number of interbank links).
MODEL STRUCTURE & PARAMETERSId: Assumptions as to what causes a bank to fail So much for propagation of shocks through interbank lending and borrowing (“IBS”). There is also the important question of shocks propagated – without direct contact between banks – by liquidity problems caused by the discounting of external assets (or, more particularly, specific “asset classes”) held by failing banks. Conventional models express such liquidity shocks (“LS”) by assuming the value of the affected assets held by non-failing banks are discounted by a factor exp(- αx), where x is the fraction of all banks holding those assets which have failed (and α is a parameter, conventionally taken to be ~1).
MODEL STRUCTURE & PARAMETERS 1e: Liquidity hoarding A third mechanism whereby shocks can be propagated is by banks “taking fright” and being reluctant to lend. Called “liquidity hoarding”, this is thought by some to be the main problem at present. See Gai & Kapadia, Liquidity Hoarding, Network Externalities, and Interbank Market Collapse. Proc. Roy. Soc. A (in press)
The ‘mean-field’ approximation Approximate the system by its mean values, eg: Each bank has an identical balance sheet Each bank is identical in terms of its number of outgoing and incoming links This number is z, the mean degree in NYYA.
Schematic model for a ‘node’ in the interbank network (IN) Liabilities (OUT) Assets “Net worth”, γi Deposits di External assets ei (1-θi)ai j i Interbank borrowing bi Interbank loans li θiai
Shocks propagating in interbank lending network are attenuated by a factor z. Thus if Phase I shock is O(s): Phase II shock is O(s/z), to zbanks/links Phase III shock is O(s/z2), toz2 links, etc.
Interbank lending+Common exposure to external assets R.M.May and N.Arinaminpathy (2009). J.R.Soc Interface
Schematic model for a ‘node’ in the interbank network SHOCK (to ei or li) (IN) Liabilities (OUT) Assets External asset, class 1 “Net worth”, γi Deposits di External asset, class 2 (1-θi)ai External asset, class 3 j Interbank borrowing bi i Interbank loans li θiai
The model There are different classes of external assets Any given bank holds external assets in n distinct classes Of these, c classes are also held by other banks Any given asset class is shared by g banks Bank 1 external assets Eg n = 2, c = 2, g = 2: Strong (α) Weak (β) Bank 2 Bank 3 Discount factor exp(-αx) Discount factor exp(-βx)
Asset class shocks accelerate with numbers of banks failing Contrast with shocks propagating via interbank lending channels, which tend to attenuate with each generation
From Gupta, S., Anderson, R. M. & May, R. M. 1989. AIDS 3, 807–817.
Ongoing work Big and small banks How should capital requirements scale with bank size? Is a financial system more sensitive to large banks, because of their size, or small ones, because of their number? Inclusion of cascades of ‘liquidity hoarding’ (cf Gai & Kapadia, forthcoming)
A PARADOX Diversification of assets can be GOOD for each individual bank, yet BAD for system as a whole
A “toy model” which illustrates this Consider N banks, and n “kinds/classes” of assets, each of which has a probability p of losing value to such an extent that a bank holding all its assets in that kind/class would fail. See Beale et al (submitted)
Two extremes (with N = n = 5) (Homogeneous) Assets 26p5 26p5 (Heterogeneous) Assets A B C D E p Probability any one bank fails p5 Probability all banks fail
Banks’ resistance to some suggested regulations may not be simple bloody-mindedness. There can be unavoidable tensions between minimizing individual banks’ risk and minimizing systemic risk. Such tensions are only one element of complex questions, but they deserve to be more thoroughly and widely recognized in discussions about regulation
Stiglitz: “Contagion, liberalization, and the optimal structure of globalization” (preprint: labelled “preliminary and incomplete”). “Financial market integration increases diversification possibilities [good!], but may also increase the risk of system failure [bad!].” His simple models illustrate the benefits of “liberalization”; he suggests “circuit breakers” (in analogy to power grids).
Bank and Hedge Fund Concentration See A. Haldane, “Banking on the State” (Nov 2009)
CONCLUSIONS: 0 Haldane in “Banking on the State”, discusses what might be done, under two headings: (a) Redesigning the Financial System (b) Redesigning Safety Nets [Insuring: Liquidity; Deposits; Capital] The following, drawing tentative conclusions from the work described above, focuses on (a)
CONCLUSIONS: 1 Under the subheading “Redesigning the Financial System”, Haldane considers: • Introducing leverage limits • Recalibrating risk weights • Rethinking capital structure • Reconsidering the industrial organization of banking
Individual vs the system There can be tensions between stability for individual banks, and that of the system Individual banks’ resistance to suggested regulation may not be simple bloody-mindedness Such tensions deserve to be more thoroughly and widely recognised in discussions about regulation CONCLUSIONS: 2
CONCLUSIONS: 3 The Interbank lending network Shocks propagated by interbank loans tend to attenuate, by O(z), with each ‘generation’. ‘Zone of instability’ tends to be maximised with a rough balance of interbank loans and external assets Glass-Steagal may have been good for system stability, whatever its faults for individual banks.
Liquidity shocks Potentially powerful effect on system stability May arise from Failure of a specific asset (and consequently ‘fire sales’) A more general loss of confidence or trust Both grow as more banks fail Initial overpricing of assets by complex, untransparent assets by Credit Ratings Agencies can make for severe liquidity shocks CONCLUSIONS: 4
Capital reserves Large capital reserves allow greater robustness of both individual banks and of the system as a whole Arguably, capital reserves should be relatively larger in boom times, when the temptation to take greater risks seems prevalent. System stability - bigger banks should hold their ratio of capital reserves to total assets at least as high as smaller banks. In practice the contrary is observed. CONCLUSIONS: 5
CONCLUSIONS: 6 Leverage limits “Onesimple means of altering the rules of the asymmetric game between banks and the state is to place heavier restrictions on leverage. … “This is an easy win. Simple leverage ratio [rules] already operate in countries such as the US and Canada. … Leverage rules … need to be robust to the seductive, but ultimately siren, voices claiming this time is different”. Haldane, Nov 2009
OUTLINE • Stability & Complexity in Ecosystems and Financial Systems • Dynamics of Networks – general – simple models – a paradox • Implications – the scale of the problem – redesigning financial systems – redesigning safety nets