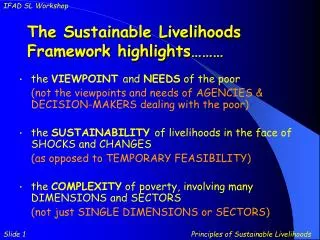
Integrated Spreadsheet for Livelihood Outcomes: Woreda Training Workshop
The Integrated Spreadsheet is a vital tool used in the Livelihoods Integration Unit for analyzing outcomes related to hazard coping mechanisms. Designed for both single zone and multi-zone analysis, the spreadsheet aids in identifying survival needs and protecting livelihoods. It incorporates data from seasonal assessments and baseline studies, ensuring households can access 2100 kilocalories without depleting their assets. Adjustments are made automatically based on food intake and sustainable sales, supporting effective livelihood protection strategies across various wealth groups.

Integrated Spreadsheet for Livelihood Outcomes: Woreda Training Workshop
E N D
Presentation Transcript
The Livelihoods Integration Unit WOREDA TRAINING WORKSHOP The Integrated Spreadsheet - for a Single Livelihood Zone
The Integrated Spreadsheet The integrated spreadsheet is the tool we use for OUTCOME ANALYSIS + HAZARD + COPING = OUTCOME Step 4 Step 5 Step 6 Compiled from data collected during seasonal assessments or monitoring Data collected during baseline + + =
The Integrated Spreadsheet • 2 types of integrated spreadsheets: • A single zone analysis - woreda level or pocket analysis B) Multi-zone analysis for up to: • 20 woredas • 12 livelihood zones • 4 wealth groups (VP, P, M & B/O)
The Excel database - single zone spreadsheet and integrated spreadsheet B & P Baseline data, information on coping strategies & population data C, L, M, O - quantitative monitoring information on crops, livestock, market prices & other data R, G, S - results, graphed results, seasonal analysis of results
How does the spreadsheet work The spreadsheet is designed to identify people’s survival needs and to protect people’s livelihoods (livelihood protection). The spreadsheet looks to see if households can access 2100 kcals without reducing their assets. In a baseline year in many livelihood zones, the poor and very poor wealth groups are consuming less than 2100 kilocalories.
The spreadsheet automatically and applies the following corrections • Households must have access to 2100 kcals. • If food intake in the baseline year is below 2100 kilocalories: the computer will adjust the baseline and take food intake to 2100 kilocalories. This is done: • キReducing the consumption of a high value crops produced by the households and • キUsing the money saved to increase food purchases. • Households are only permitted to make sustainable sales of livestock. • Sustainable off-take rates are set at 40% for the very poor and poor households and 50% for middle and better-off households.