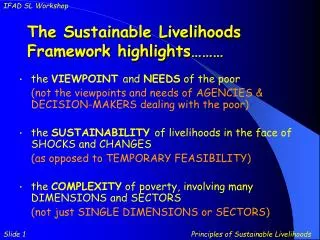
Understanding Livelihoods Integration for Enhanced Emergency and Development Planning
210 likes | 322 Vues
The Livelihoods Integration Unit employs the Household Economy Approach (HEA) to analyze livelihoods, focusing on food and non-food needs during emergencies and development planning. This training outlines effective strategies for identifying needs and interventions, including school and health costs, cash transfers for basic household items, and agricultural support. Assessment outcomes guide targeted interventions, ensuring appropriate support for different wealth groups impacted by changing market conditions. By understanding local livelihoods dynamics, stakeholders can enhance their response to food insecurity and support community resilience.

Understanding Livelihoods Integration for Enhanced Emergency and Development Planning
E N D
Presentation Transcript
The Livelihoods Integration Unit Woreda Training Examples of Outputs using HEA
HE Analytical Framework An understanding of livelihoods is at the heart of HEA – leading to its application beyond emergency food needs Disaster Response Rehabili- tation Early Warning Contingency Planning Development Planning
Identifying Non-Food Needs in an Emergency… Expenditure Patterns of Poor Households (WMR LZ) • Appropriate non-food interventions include: • Measures to cover school and health costs (approx. 90 birr) • Credit for fertilizer and seed costs (approx. 40 birr) • A cash transfer to cover basic household items (100-200 birr) HEA Outcome Analysis used to identify food/ cash needs in biannual needs assessment
HEA information can facilitate targeting Wealth group description by LZ VP P M B/O
Seasonal Calendar – Rift valley maize and haricot bean LZ Malaria and food purchase occurs when harvest is about to come affecting households
North east Agro pastoral livelihood zone Livestock product consumption is important for the middle and better-off hhs
North east Agro pastoral LZ The lion’s share income for all households come from livestock sale
Kofele and Kokosa Cattle and Enset LZ The significant annual incomes for better off and middle group are livestock sale followed by crop sale.
Assessment Schedule: Current: Belg Meher An Example of an HEA analysis from this Assessment: Gondar Zuria, N Highland Wheat, Barley & Sheep LZ Poor households in this LZ are heavily dependent on migration for labour in the neighbouring North West Cash Crop LZ Poor crop production in this cash crop zone will reduce the opportunities for migrant labour this year Labour migration: Sesame harvest Sep-Nov
This analysis shows the effect of crop failure in the North West Cash Crop LZ, to which people migrate for labour... With normal migration Livelihoods Protection Threshold Survival Threshold
Livelihoods Protection Threshold Survival Threshold An Example of an HEA analysis from this Assessment: Gondar Zuria, N Highland Wheat, Barley & Sheep LZ This analysis shows the effect of crop failure in the North West Cash Crop LZ, to which people migrate for labour... With reduced migration ...a reduction in labour opportunities and a lower labour rate is expected to reduce total food income to below the survival threshold
Development of Livelihoods-Based Monitoring Systems • Key parameters are the most important measures of food and cash income to be monitored by livelihood zone and woreda • They are identified on the basis of their contribution to food and cash incomes in the reference year • Monitoring these variables during both the seasonal assessment and on-going monitoring will ensure that key changes affecting local livelihoods can be tracked
Outcome Analysis - the starting point for appropriate interventions food intervention cash intervention non-food intervention food deficit market intervention Example of outcome analysis for poor households in 1 livelihood zone who are facing a 30% food deficit Free food or food for work is one way of filling the food deficit Other alternatives are: A direct cash intervention or support to income generation… and households can purchase food with the additional income In addition to food, households spend money on education, health, water, inputs, other essentials. Provision of these items can release cash that can be used for food purcahse Increasing food prices, often reduces households ability to purchase food. Price stabilisation mechanisms - eg increasing food available in the market - may help household purchasing power KEY Left hand bar illustrates food access as a percentage of minimum annual food energy needs. Right hand bar - show the pattern of cash expenditure as a percentage of the baseline
Identifying Non-Food Needs … Expenditure on inputs is applicable for the better-off and middle households only. The amount of cash spent on each category as well as the quantity and quality of items purchased varies depending on the economic status of each socio-economic group. All wealth groups, except the better-off, purchase staple food. Expenditure on clothing and social services like health and education is minimal for the very poor and poor. South Wollo Belg LZ
Outcome Analysis for 2006 Dara Woreda (Sidama Zone) Sidama Coffee LZ Sources of Income Sources of Food Middle households Very poor households Very poor households • Very poor households in cash-cropping areas purchase most of their food. • A decline in cash income and an increase in maize prices means a bigger deficit in 2006 than 2004. Coffee prices increased to 215% Coffee production decreased to 70% Maize increase to 140% Livestock prices increased • Higher prices for coffee and livestock will increase incomes for middle households • A reduction in coffee production means less work and less income for the very poor (1 in 6 households). An ACF nutrition survey in June 2006 found the following high levels of malnutrition: GAM: 16.5 % (95% C.I. 12.5 - 20.5) of GAM SAM: 3.1 % (95% C.I. 1.4 - 4.8) of SAM. Five edema cases were identified. Source: ACF Nutrition and retrospective mortality survey, Sidama Coffee livelihood zone, Dale and Aleta Wondo Woredas, SNNPR, Ethiopia, June 2006
Summary: Livelihood baselines can be used: Assess emergency food & non-food needs needs Inform targeting Interpret nutritional status data Facilitate health, nutrition, livestock, water, PSNP programming