Download
1 / 29
290 likes | 422 Vues
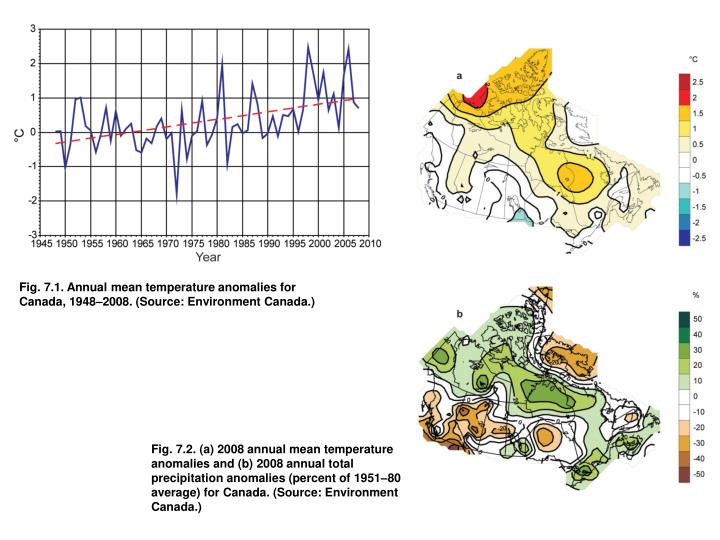
Fig. 7.1. Annual mean temperature anomalies for Canada, 1948–2008. (Source: Environment Canada.). Fig. 7.2. (a) 2008 annual mean temperature anomalies and (b) 2008 annual total precipitation anomalies (percent of 1951–80 average) for Canada. (Source: Environment Canada.).

E N D
Fig. 7.1. Annual mean temperature anomalies for Canada, 1948–2008. (Source: Environment Canada.) Fig. 7.2. (a) 2008 annual mean temperature anomalies and (b) 2008 annual total precipitation anomalies (percent of 1951–80 average) for Canada. (Source: Environment Canada.)
Fig. 7.3. Annual mean temperature for the contiguous United States, 1895–2008. (Source: NOAA/NCDC.) Fig. 7.4. Statewide ranks of (a) annual 2008 temperatures and (b) annual 2008 precipitation. Arank of 114 represents the warmest/wettest year since 1895. Much-above-normal temperature/precipitation is defined as occurring in the top 10% of recorded years, which corresponds to a rank of 104–113. Above-normal temperature/precipitation is defined as occurring in the warmest/wettest third of recorded years (ranks 77–103). Much-below-normal temperature/precipitation is likewise the bottom 10% of coolest/driest years since 1895, and below normal is defined as the remaining coolest/driest third of the distribution. (Source: NOAA/NCDC.)
Fig. 7.5. South-central Texas Dec–Jun precipitation (1896–2008, blue curves) and proxy precipitation from tree rings (1652–1995, red curves). Annual values are shown as thin curve; 5-yr smoothed values are shown as thick curves. (Source: NOAA/NCDC/Paleoclimatology Branch.) Fig. 7.6. Time series of annual land temperature departures (°C) for the contiguous United States during 1895–2008 based on (top) NCDC climate division observational analyses, (middle) the ensemble of CMIP simulations forced with observed greenhouse gas, aerosol, solar, and volcanic aerosol variability, and (bottom) the ensemble of AMIP simulations forced with observed global sea surface temperature variability. Bars plot the annual departure, computed relative to a 1971–2000 reference period, and the black curve is a 9-point Gaussian filter applied to the annual values.
Fig. 7.8. (a) Feb mean temperature anomalies for Cuba (°C; based on 1971–2000); (b) annual total rainfall expressed as deciles (based on 1971–2000; preliminary analysis). (Source: Institute of Meteorology of Cuba.) Fig. 7.7. (a) Annual mean temperature anomalies for Mexico (°C, based on 1971–2000); (b) seasonal total precipitation anomalies (May–Oct) (percent of 1971–2000). (Source: National Meteorological Service of Mexico.)
Fig. 7.9. Monthly Jamaican rainfall for 2008 (bars), climatology (black), and one std dev from climatology (dashed). The reference period is 1971–2000. (Source: Meteorological Service of Jamaica.) Fig. 7.10. Weekly precipitation expressed as percentage of normal rainfall (left-hand side) for six distinct sectors of Puerto Rico. The average for the island is in bold and the weekly average totals are given on the bottom.
Fig. 7.11. (a) Annual mean temperature anomalies for South America for 2008 (°C); (b) annual total precipitation anomalies (% normal). The reference period is 1971–2000. [Sources: National Meteorological Services of Argentina, Brazil, Bolivia, Chile, Columbia, Ecuador, Guyana, Paraguay, Peru, Uruguay, Venezuela, and CPTEC (Brazil). Data compilation and processing by CIIFEN 2008.] Fig. 7.12. Accumulated precipitation (mm) in southern Brazil during 20–25 Nov 2008. (Source: CPTEC/INPE.)
Fig. 7.13. Annual total rainfall deficit in central-east Argentina and Uruguay during 2008. The reference period is 1961 to 1990. (Source: CIIFEN 2008.) Fig. 7.14. Accumulated rainfall at Salto (Uruguay) during 2008 (brown) an accumulated normal (green). (Source: CIIFEN 2008.)
Fig. 7.15. Daily mean temperature for 2008 and the long-term average for Egypt. (Source: Weather Service in Egypt.) Fig. 7.16. Daily maximum temperature anomalies on 1 Jul 2008 for northern Africa (°C, 1968–96 reference period). (Source: CDC, NOAA.)
Fig. 7.17. May to Oct 2008 accumulated precipitation anomalies (mm) for western African (1971–2000 reference period). (Source: GPCC, Version 2 Monitoring Product.) Fig. 7.18. Jun to Sep 2008 Sudan total rainfall expressed in percentage of normal (1971–2000 reference period). (Source: National Weather Service of Sudan.)
Fig. 7.19. Cumulative rainfall over (a) the northern sector (Nekmite, Ethiopia), (b) the equatorial sector (Moyale, Kenya), and (c) the southern sector (Kigoma, Tanzania). (Source: ICPAC 2008.) Fig. 7.20. Annual mean temperature anomalies for South Africa, 1961–2008 (1961–90 reference period). The dark line represents a 5-yr running mean. (Source: South African Weather Service.)
Fig. 7.21. Annual total rainfall anomalies for Zimbabwe, 1900–2008 (mm; 1971–2000 reference period). (Source: Meteorological Service Department of Zimbabwe.) Fig. 7.22. Annual total rainfall anomalies for South Africa (expressed as percentage of the 1961–90 average) for Jul 2007 to Jun 2008. (Source: South African Weather Service.)
Fig. 7.23. Total rainfall anomalies over southern Africa for Nov 2007 to Apr 2008 (mm). The black box denotes areas that are climatologically wet during summer. (Source: NOAA.) Fig. 7.24. Annual mean temperature anomalies in Europe and over the North Atlantic, 2008 (°C, 1961–90 base period) based on CLIMAT and ship observations. [Source: DWD.]
Fig. 7.25. Seasonal anomalies (1961–90 reference period) of sea level pressure (contour, hPa) using data from the NCAR–NCEP reanalysis. The colored shading represents percentage of accumulated seasonal precipitation compared with the 1951–2000 climatology using the seasonal GPCC precipitation data set: (a) winter (Dec 2007–Feb 2008), (b) spring (Mar–May 2008), (c) summer (Jun–Aug 2008), and (d) autumn (Sep–Nov 2008). Some intense precipitation anomalies in the southern Mediterranean during seasons when it usually rains very small amounts are filtered out.
Fig. 7.26. European precipitation totals (percentages of normal, 1951–2000 base period) for the whole year 2008. (Source: GPCC; Rudolf et al. 2005.) Fig. 7.27. European surface air temperature anomalies (°C, 1961–90 base period) from HadCRUT3 for (a) Dec 2007–Feb 2008, (b) Mar–May 2008, (c) Jun–Aug 2008, and (d) Sep–Nov 2008.
Fig. 7.28. May 2008 mean temperature anomalies in Europe, (°C, 1961–90 base period), based on CRUTEM3 dataset (Source: Brohan et al. 2006). Fig. 7.29. European precipitation anomalies (percentages of normal, 1951–2000 base period) in May 2008. (Source: GPCC; Rudolf et al. 2005.)
Fig. 7.30. Aug 2008 mean temperature anomalies in Europe (°C, 1961–90 base period), based on CRUTEM3 dataset (Source: Brohan et al. 2006). Fig. 7.31. Time series of winter NAO(after Jones et al. 1997, Dec to Mar average). Image from www.cru.uea.ac.uk/~timo/projpages/nao_update.htm, updated 27 Jan 2009.
Fig. 7.32. Anomalies of mean annual air temperatures averaged over the Russian Territory, 1939–2008 (against 1961–90 normals).
Fig. 7.33. Air temperature anomalies in Jan 2008. Insets show mean monthly and mean daily air temperatures in Jan 2008 at meteorological stations Marresalya, Anadyr’, and Ust’-Koksa.
Fig. 7.34. Precipitation total in Jul 2008 against normal. Insets show monthly precipitation total series in Jul and daily precipitation in 2008 at meteorological stations Moscow, Chertkovo, Kislokan, and Srednekolymsk.
Fig. 7.35. Air temperature anomalies in Dec 2008. Insets show mean monthly and mean daily air temperatures in Dec 2008 at meteorological stations Marresalya, Omolon, and Olekminsk.
Fig. 7.36. Snow covers the region of southwest Asia, from Turkey in the west to Iran in the east, on 15 Jan 2008. NASAimage courtesy Jeff Schmaltz, MODISRapid Response Team at NASAGSFC (http://earthobservatory.nasa.gov/NaturalHazards/view.php?id=19555). Fig. 7.37. Annual mean temperature anomalies (°C; 1971–2000 base period) over East Asia in 2008. (Source: JMA.)
Fig. 7.38. Annual precipitation ratio as percentage of normal (1971–2000 base period) over East Asia in 2008. (Source: JMA.) Fig. 7.39. Variation of pentad zonal wind index over monitoring region(10º–20ºN, 110º~120ºE), red open bars stand for climatology (Unit: m s−1) (Source: CMA.)
Fig. 7.40. Monsoonal (Jun–Sep) rainfall (mm) and anomalies (percentage departure from normal) over India in 2008. Fig. 7.41. Daily standardized rainfall time series averaged over the monsoon zone over India (1 Jun to 30 Sep 2008).
Fig. 7.42. Percentage of normal precipitation (base period 1951–2000) for seasons Dec–Feb. (Source: GPCC.) Fig. 7.43. Percentage of normal precipitation (base period 1951–2000) for seasons Sep–Nov. (Source: GPCC.)
Fig. 7.44. Winter mean temperature anomaly (°C) for Iran. (Source: IRIMO.) Fig. 7.45. Spring precipitation anomaly (percentage of normal) for Iran. (Source: IRIMO.)
Fig. 7.46. Monthly mean temperatures (°C) for Turkey in 2008. Fig. 7.47. Jan 2008 temperature anomalies (°C; base period 1971–2000) for Turkey.
Fig. 7.48. Australian mean annual maximum temperature anomalies (°C; 1961–80 base period) for 2008. Fig. 7.49. Australian annual rainfall deciles for 2008.
Fig. 7.50. Mean annual temperature anomalies (ºC) over New Zealand, from 1853 to 2008 inclusive, based on between 2 (from 1853) and 7 (from 1908) long-term station records. The blue and red bars show annual differences from the 1971–2000 average; the solid black line is a smoothed time series. Fig. 7.51. Outgoing longwave radiation anomalies (W m−2) in the southwest Pacific for Apr 2008. Solid line indicates the location of the SPCZ. Dashed line indicates the normal location of the SPCZ in Apr.
Fig. 7.52. Annual rainfall (mm) for American Samoa and selected Micronesian islands for Jan through Dec 2008. Numbers above the bars indicate the annual rainfall as a percent of normal as determined from the NCDC 1971–2000 base period.