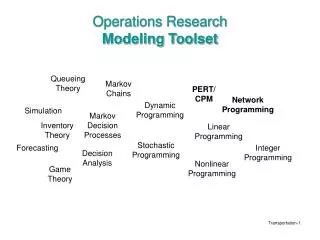
CRP 834: Decision Analysis
CRP 834: Decision Analysis. Week Eight Notes. Monetary-based technique Financial Investment Appraisal Cost-effective analysis Cost-benefit analysis Multicriteria technique Check-list of criteria Goals-achievement matrix Planning balance sheet analysis Concordance-Discordance

CRP 834: Decision Analysis
E N D
Presentation Transcript
CRP 834: Decision Analysis Week Eight Notes
Monetary-based technique • Financial Investment Appraisal • Cost-effective analysis • Cost-benefit analysis • Multicriteria technique • Check-list of criteria • Goals-achievement matrix • Planning balance sheet analysis • Concordance-Discordance • Statistical Technique • Correspondence analysis (principal component analysis) • The information theory (entropy) • Optimization techniques • Multi-Objective Programming Plan Evaluation Methods
Review of Cost-Benefit Analysis • Monetary-based technique • When evaluating over time, need to consider discount rate • The concept of consumer surplus
Cost-Benefit Analysis—ExamplesCase 1: The Simplest Case • The planner is asked to design a project to provide 100 mgd of usable water, and there is but one feasible source. • There are only two sensible designs – one with higher first costs, but lower OMR costs, and the other with lower first costs but higher OMR costs.
Case 1 (cont’d) Example: Economic life of structure – 50 years (with discounting)
Case 1 (cont’d) • (Warning) Need to consider benefits and costs realized at different time. • Inflation • Risk and uncertainty on the rate of return • Internal rates of return: • NBpv=(B0-C0)+ (B1-C1)/(1+r)+ (B2-C2)/(1+r) 2 +… • 0=(B0-C0)+ (B1-C1)/(1+i)+ (B2-C2)/(1+i) 2 +… • Where r is the interest rate, and i is the internal rate of return.
Case 2: Two Potential Reservoirs(Q) How to design the project for the optimal costs and benefits? Reservoir Storage – Yield Data Goal: To produce output of 100 mgd of usable water at least cost!
Case 2 (Cont’d) Reservoir-Cost Data Cost = Capital Cost + PV of OMR cost ( 50 year period, discount rate 5%)
Case 2 (Cont’d) • Step 1: Estimate cost function • Ci=f(xi), where Ci = cost, xi=reservoir capacity • Step 2: Estimate Production (yield) • Yi=f(xi), where yi = yield, xi=reservoir capacity • Step 3: Establish Iso-Output Function of combinations of Reservoirs I and II for 100 mgd usable water • Step 4: Establish Iso-Output Function of combinations of Reservoirs I and II • Step 5: Find the least cost combination of reservoirs using the point of tangency
Case 2 (Cont’d) Iso-Output Function of combinations of Reservoirs I and II Combinations of Reservoirs I and II that will provide 100 mgd of usable water Iso-Cost Function of combinations of Reservoirs I and II Combinations of Reservoirs I and II with total cost of $ 5.5 million.
Iso-output curve =100 mgd Iso-cost curve = $ 5.5 M 25 50 75 100 Least cost combination is at tangency of two curves: Res. I =50 *103 acre feet –$ 4.5 MRes. I =12 *103 acre feet --$ 1.5 M 25 50 75 100 Case 2 (Cont’d)
100 75 50 25 Res. II - Storage Capacity 103 acre Scale line Scale line 150 mgd 100 mgd 125 mgd 50 mgd 75 mgd 25 50 75 100 Res. II - Storage Capacity 103 acre Case 3: Two Reservoirs without specifying fixed water supply Points of tangency 1.
Case 4: The optimal yield at a minimum cost with budget constraint MC=MB Scale of output at which slopes of benefit and total cost functions are equal. 20 Gross Benefit PV Costs and Benefits ($ M) 10 Total Cost Capital Cost 3 25 50 75 100 125 Maximize NB = B(y) - C(y) Subject to: K(y) < B (Budget Constraint)
Multicriteria - Basic Problem Definition: a multicrtieria decision problem is a situation in which, having defined a set of actions (A) and a consistent family (F) of criteria on A, one wishes • to determine a subset of actions considered to be the best with respect to F • to divide A into subsets according to some norms (sorting problems) • to rank the actions of A from best to worst (ranking problems)
Balance Sheet of Project Evaluation • Can be viewed as a particular application of the social cost-benefit approach to evaluation • Developed by Lichfield and widely used in England • Considers all benefits and all costs with respect to all community goals in one enumeration • Presents a complete set of social accounts, with respect to different goals, and for consumers and producers • The costs and benefits are recorded as capital (once for all) items or annual (continuing) items. Types of evaluation considered: monetary, quantitative but non-monetary, intangible, and time.
Check List Criteria • Ranks appropriate alternative proposals on an ordinal basis in relation to a number of specific criteria. • Widely used by professional land-use planners
Goals-Achievement Matrix • Developed by Hill (1965) • M Hill. 1965. A Goals-Achievement Matrix for Evaluating Alternative Plans. Application to Transportation Plans. Journal of the American Institute of Planners , Vol. 34, No. 1, 19-29. • This method attempts to determine the extent to which alternative plans will achieve a predetermined set of goals or objectives • Costs and benefits are always defined in terms of achievement. • Benefits represent progress toward the defined objectives, while costs represent retrogression from defined objectives. • The basic difference between PBSA and GAM is that GAM only considers costs and benefits with reference to well stated objectives, and to well defined incidence groups.
Concordance-Discordance analysis • It consists of a pair-wise comparisons based on calculated indicators of concordance or discordance. • The concordance index reflects the relative dominance of a certain competing plan, and the discordance index shows the degree to which the outcomes of a certain plan are worse than the outcomes of a competing plan.
Multi Objective Programming (MOP) • Basic Concepts and Definition of MOP • Non-Dominated Solutions • Generating/Incorporating Methods • Weight Method • Constraint method • MOP under uncertainty
Why MOP? • Multiple decision makers • Multiple evaluating criteria • Wider range of alternatives • More realistic analysis of problems * In fact, any optimization is (or should be) multiobjective!!!!
MOP Formulation(Vector Optimization Problem) • Aims to find a vector satisfying: Where Z(x)= p-dimensional objective function x= feasible region in decision space