Download
1 / 13
130 likes | 297 Vues
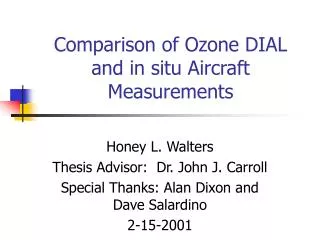
Comparison of Ozone DIAL and in situ Aircraft Measurements. Honey L. Walters Thesis Advisor: Dr. John J. Carroll Special Thanks: Alan Dixon and Dave Salardino 2-15-2001. Objective. Compare NOAA DIAL and UCD aircraft ozone measurements Overall performance Altitude or time of day dependence.

E N D
Comparison of Ozone DIAL and in situ Aircraft Measurements Honey L. Walters Thesis Advisor: Dr. John J. Carroll Special Thanks: Alan Dixon and Dave Salardino 2-15-2001
Objective Compare NOAA DIAL and UCD aircraft ozone measurements • Overall performance • Altitude or time of day dependence
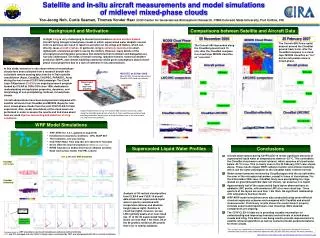
Data • SCOS97-NARSTO (Southern CA Ozone Study-North American Research Strategy for Tropospheric Ozone) • El Monte, CA • NOAA Lidar (National Oceanic and Atmospheric Administration) • DIAL (Differential Absorption Lidar) • UCD instrumented aircraft • U.V. Photometric Ozone Analyzer
Procedures • Match up corresponding data (i.e. same day, time, and altitude)-39 total matching profiles • Average UCD O3 in 15 m layers to match up with NOAA altitude • Determine mean bias between UCD O3 and NOAA O3 and RMS difference for each flight • Look at data in 100 m altitude bins (i.e. 200-300 m, 300-400 m…) to determine bias for time of day and altitude range
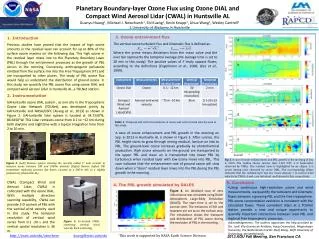
Data-Difficulties • NOAA determines O3 at all altitudes at the same time • UCD aircraft cannot obviously be at all altitudes at the same time • UCD is 10 s averaged and NOAA is averaged on the order of 6+ minutes • Unsteady [O3] as indicated by sequential NOAA O3 profiles
Conclusion • UCD and NOAA O3 compare well at most times and locations • Evening flights compare poorly due to lack of matching data, poor time matches, and unsteady O3 conditions • There are poor comparisons near ground and at higher altitudes (800m +) • When the NOAA O3 profile shows conditions to be unsteady, there s a larger bias and an increase in noise (RMS) • There is no significant difference between upward aircraft spirals and downward aircraft spirals