Download
1 / 55
550 likes | 666 Vues
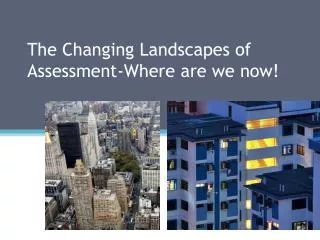
The Changing Landscapes of Assessment-Where are we now!. Fluid Global Economies. Software written in India . . . MRI’s read moments later by radiologist in Australia Pilots in U.S. guide unmanned aircraft in Afghanistan. Source: National Academy of Science.

E N D
Fluid Global Economies • Software written in India . . . • MRI’s read moments later by radiologist in Australia • Pilots in U.S. guide unmanned aircraft in Afghanistan
Source: National Academy of Science • U.S. International Test Scores30 Most Industrialized NationsMathematics 25Science 21
What do international tests really show about US student performance? • 2009: Duncan says “American students are poorly prepared to compete in today’s knowledge economy.” Comments from a PISA report. • 2012: Duncan says the results “underscore the urgency of accelerating achievement in secondary school and the need to close large and persistent gaps and calling particular attention to the fact that the 8th grade score in mathematics for US students failed to improve since the previous administration of the TIMSS.” • Martin Carnoy and Richard Rothstein, January 28, 2013
The purpose of this linking is to project the NAEP achievement levels onto the TIMSS scale.
Next Generation Science Standards • Political climate • Too much, too soon-CCSS • Professional development • Opposition by Fordham and think-tanks
National Assessment of Educational Progress • Math • ELA • Science • Writing • TEL • HOTS/ICTS • KSA • History • Arts • NAEP becomes completely computerized in 2017 • State/National results • State/National Results • Voluntary State Results • Voluntary State Results • National results • National results • National results • National results • National Results
International Assessments • Tends in International Mathematics Science Study (TIMSS) • Program for International Student Assessment (PISA) • Progress in International Reading Literacy Study (PIRLS) • Survey of Adult Skills (PIACC)
Non-State Assessments Poll • Conducted February 2014 • Sent to NAEP State Coordinators • Received responses from 49 ‘states’
Non-State Assessments Poll Poll: State Uses of Non-State Assessments This survey was created by Pam Byrd (NSC-Arkansas), Mark DeCandia (NSC-Kentucky), Kate Beattie (NSC-Minnesota), and Laura Egan (NSSC) and is a part of a project that we are working on. In our project, we are seeking to develop a better understanding of the changing assessment landscape and how this changing assessment landscape interacts with education policy at the state level. We seek your assistance in gathering data on how states are using non-state assessments (e.g., NAEP and international assessments) and how these assessments fit into the state assessment system. Please forward this survey to the person in your department of education who can answer questions about assessments and their impact on educational policy in your state. Your state's participation is greatly appreciated.
Poll Results: Inform State Policy Examples • Planning for transition to CCSS • Data from the results and released items have been used by the Superintendent when speaking with numerous stakeholder groups to help inform discussions and policy making in respect to validating the more rigorous [State] Standards (aka Common Core Standards) • Especially with transition to Common Core aligned assessments, looking at NAEP results to plan transition and communication, and using NAEP frameworks to design PD.
Poll Results: Inform State Policy Examples • Revising standards • Informally, when the [State] Standards were going under revision in 2009 the TIMSS frameworks were looked at in the process. • Frameworks are referred to for comparison and push to increase rigor. • Setting benchmarks • NAEP and TIMSS were used to inform benchmark for proficiency. • Use NAEP scores as a guide for our state assessment cut scores. • The TIMSS frameworks were used to inform the development of [State] achievement level descriptors (ALDs). The final ALDs were used in standard setting for the new college and career assessments.
Poll Results: Inform State Policy Examples • Non-cognitive data • I used the contextual variables in a presentation for the [state] Educational Research Assessment Conference in Dec. It was interesting, at least people had lived in the China and Japan and could add insight into the information I was able to retrieve from the contextual variables. • Linking • [State] estimated state assessment scale scores for averages on the international assessments as part of achievement standards reviews in reading, math and science.
Poll Results: Inform State Policy Examples • Other • My state is very interested in getting more international results. • PISA was used early on (early 2011) as an example of what Smarter Balanced was aiming toward. • Uses NAEP results to inform where schools statewide may need to fortify instruction or funding for instruction.
Poll Results: Formal Recognition/Use Select explanations for ‘Other’ • Board presentations and Governor’s office • Testimony to Legislature • I am in the process of posting international assessment information on the website • International assessments are mentioned on the website but results, etc. are not posted. • No statutory requirement to participate in international assessment, at this time. • NSC regularly presents NAEP information at state level conferences for teachers, parents and administrators.
Poll Results: Importance Select comments • International assessments where we don't get state level results are too difficult for policy makers to sort out for decision making. • PISA and PIRLS do not supply statewide linking or validation studies or it would be just as important as NAEP and TIMSS.
Final comments • The state is trying to make NAEP a more prominent figure in state policy and decision making processes but historically, little attention has been given to NAEP and/or international assessments. Efforts are underway to change this perception. • The superintendent is extremely supportive of NAEP and participation in the international assessments. We participate in the national results level international assessments however do not have funding to opt to participate in the additional state level international assessments to receive state level results. • Various pending legislations may alter state's participation in consortium assessments, delay participation in consortium assessments, change or end the use of Common Core in state education. • [State] uses NAEP as its outside indicator of progress. [State] would like to expand this to state level results on international assessments.
Effect Sizes State, national and international assessments
Effect sizes • Tip sheet • Compliments the p-value • Effect size gives you an idea (visual) of the size of the difference • Estimated magnitude of a relationship
The Minnesota Case [Kate – you’ll want to situate this] • Participated in TIMSS 1995, 2007, 2011 as ‘mini-nation’ • Implemented new standards in 1995, 2007 that make content coverage more closely resemble that of TIMSS test • Scores generally improved from 1995 to 2011, and MN saw faster growth than US as a whole • Engaged education stakeholders, business community, general public in discussion of TIMSS results, what they meant, and how they could inform policy
Questions to answer • Are effect sizes consistent across assessments? • Do gains/gaps compare across tests? • Do the gap closures reflect real improvement?
Reading Effect sizes for 4th grade on MCA and NAEP 2007-2013 MN Reading test changed in 2013
Reading Effect sizes for 4th grade on MCA, NAEP and PIRLS 2007-2011
Reading Effect sizes for 4th grade on MCA, NAEP 2007-2013 MN Reading test changed in 2013
Reading Effect sizes for 8th grade on MCA and NAEP 2007-2013 MN Reading test changed in 2013
Reading Effect sizes for 8th grade on MCA and NAEP 2007-2013 MN Reading test changed in 2013
Math Effect sizes for 4th grade on MCA and NAEP 2007-2013 MN Math test changed in 2011
Math Effect sizes for 4thgrade on MCA, NAEP and TIMSS 2007-2011 MN Math test changed in 2011
Math Effect sizes for 8th grade on MCA, NAEP and TIMSS 2007-2011 MN Math test changed in 2011
Math Effect sizes for 8thgrade on MCA, NAEP and TIMSS 2007-2011 MN Math test changed in 2011
Difference between Reading gr 4 W-B mean scores on NAEP and MCA
Difference between Reading gr 8 W-B mean scores on NAEP and MCA
Difference between Math gr 4 W-B mean scores on NAEP and MCA
Difference between Math gr 8 W-B mean scores on NAEP and MCA