Download

1 / 63
630 likes | 857 Vues
Regional Variations of Demographic Transitions: China’s Changing Demographic Landscapes. Max Lu Department of Geography Kansas State University maxlu@ksu.edu. Topics to be Covered. Population size Growth Distribution Ethnic composition Changing demographic landscapes An activity.

E N D
Regional Variations of Demographic Transitions: China’s Changing Demographic Landscapes Max Lu Department of Geography Kansas State University maxlu@ksu.edu
Topics to be Covered Population size Growth Distribution Ethnic composition Changing demographic landscapes An activity
The most populous country in the world 1.335 billion at the end of 2009 Just under 1/5 of the world’s total > 4 times as large as the US pop. Large than the combined populations of Europe, the U.S., Canada, Mexico, Russia, and Japan Europe 584.7 mil the US 297.1 Canada 32.2 Total: 1294.6 (2008) Mexico 110.5 Russia 142.2 Japan 127.9 Lined up shoulder to shoulder, could go around the earth over 30 times!
Still growing at about 7 million a year But India is expected to pass China in 2025 Population: both Greatest Asset and Liability Several of China’s demographic traits are similar to those of developed countries
China Compared to the US Source: PRB, 2009 ChinaUS • Total pop (mid-2009) 1,331.4 306.8 • Density (pop/mi2) 360 83 • Birth rate 12 14 • Death rate 7 8 • TFR 1.6 2.1 • Infant mortality 21 6.6 • Life expectancy m. 71, f. 75 m.75, f.80 • % Urban 46 79 • % of pop > 65 yrs 8 13 • Per capita GNI ppp $6,020 $46,970
Population Growth For a pop to grow steadily, several conditions must be met: • Enough food to feed pop. • Sufficient medical care, so people don’t die young • Capacity to cope with natural disasters • Minimum political turmoil Chinese pop. fluctuated considerably over time Intro of potatoes boosted pop. growth
Rapid Increase after 1949 • It took about 3800 yrs to increase from 10m to 100 mil • Net increase in recent periods: 1949-58 120 mil 1962-70 157 1971-80 135 1982-90 127 1990-00 132 • Exceeded 1 billion in 1982 • Need to slow down
Population Distribution Where Most People Live: • Near Coasts • Flat Terrain • Near Rivers • Temperate Climates • Fertile Soil China’s Pop Distribution: • Very Uneven • Striking Differences b/w East and West
World Population Distribution 4 Clusters:East Asia S. Asia Europe NE US & SE CA
West-East Contrasts WestEast • Land 60% 40% • Climate Arid/Semi Arid Humid • Pop. About 80 m 94% Many minorities Han Majority Sparsely populated Densely populated • Cities Some Most • Agri. Limited/Oasis Most agr. land
Ethnic Composition • 56 ethnic groups • Han people The majority - about 94% of the total Reside mainly in the east
Minority Nationalities • Several are Big (in millions, Year 2000) Zhuang 16.2 Million Manchu 10.7 Hui (Muslim) 9.8 Miao 8.9 Uygurs 8.4
Some Are Small Naxi 308,800 People Once a Matriarchal Society “A-Zhu” Marriage Dai 1.2 Million
China's Birth Control Policy: More than “One Couple, One Child”
Pre-Policy • Traditional culture values large families • In the early 1950s under the rule of Mao Zedong birth control policies were condemned. Mao said that controlling the population was “a way of slaughtering the Chinese people without drawing blood.” • “…[the people] are the most precious of all categories of capital.”
Late, Thin, and Few • A campaign launched in 1971 • Delayed marriage/childbirth, spacing births at 5-year intervals, and fewer children per couple • Contraceptives widely distributed, free of charge • Require government permission to have children • Family Planning Committees at all levels of governments “Birth control nannies” Intrusive questions
“One Couple, One Child” • Adopted in 1979 • The harshest birth control policy in the world? • Couples are asked to pledge to having only one child
Incentives • Free prenatal care • Many rewards (mainly to urban residents): larger homes, larger salaries and promotions. • Better, often free education for the only children. • Paid maternity leave, 3-6 months, or longer • The government generally pays for the birth control costs.
Consequences of Violation • The official sanction is a fine, but many times much more harsh actions are taken. • Sometimes couples are demoted or fired from their jobs. • Those having 2nd child cannot register them and therefore they do not legally exist.
Many exceptions for second child have been introduced since 1984 Examples: • Both members of the couple are only children • First child is disabled • For rural residents, if first child is a girl • Remarried couples • Minority couples
Debate on the “One Couple, One Child” Allow each couple to have two children? pros vs cons
The Impetus for Change • Unprecedented Socioeconomic Transitions - From a socialist economy to a market economy - From an agrarian society to an urban, industrial giant - A growing middle class, - Changes in values and social norms • Birth Control Policies - Traditional culture favored large families and male heir - Birth control practice in the early 1970: Late, thin, few - “One couple, one child” in 1979 - Modifications of the one child policy
The Changing Demographic Landscapes • Decline in Fertility • A Rapid Demographic Transition • Aging • A Skewed Sex Ratio • Large-scale Internal Migration esp. rural-urban migration • Whither One Couple, One Child?
Decline in Birth Rates TFR: 1971: 5.44 2009: 1.6 Fell below replacement level since 1992 Well below 1.0 in large cities (Beijing, Shanghai, etc.) Birth rate: 1970: 33.43‰ 2009: 12.13‰ Natural growth: 1970: 25.83‰ 2009: 5.05‰ Shanghai: negative growth 17 years in a row so far Significantly lowered pop growth 1971-2009: 400 million fewer people were born because of family planning ??
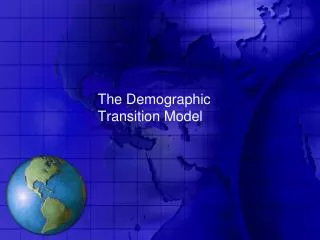
China’s Demographic Transitions 1949, 2nd stage of demographic transition High birth (36‰), high but declining death (20‰) Early 1960s: 3rd stage Birth and death rates started to converge Late 1970s: 4th stage Low birth and death rates
Population Aging The “Graying” of the Chinese Population: 2015: 10% 2035: 20% 2050: 25%
Population aging • 2000 • % 65 yrs or older: 6.96% 2009: 8% • Elderly growing at 3.2% each year • May reach 10% at 2015, and 20% at 2035
Getting Old before Getting Rich • According to a UN study, China is aging faster than other country in history. • The median age is on pace to move from the current 32 years to 44 years by 2040.
Skewed Sex Ratio Currently at 119:100 surfeit of boys and dearth of young women Increase by birth order Substantial regional differences 3 Main Reasons: Son preference Use of prenatal sex-detecting technology Declining fertility In 2020, 30-40 million more young men than women Social repercussions “Demographic time bomb”
The “Care for Girls” Program Launched in 2003 Changing Son Preference?