Download
1 / 40
400 likes | 519 Vues
This article explores the intersection of cognitive processes and visualizations in data interpretation. It discusses how visual queries rely on recognizing patterns informed by Gestalt principles, like proximity and continuity, as well as the connection between visual and verbal inputs in problem-solving. The research highlights the architecture of visual thinking, emphasizing the role of working memory and cognitive load in effective navigation and interaction with data displays. Insights into optimizing visual programming and maintaining context in visual searches are shared to improve the design of visualization tools.

E N D
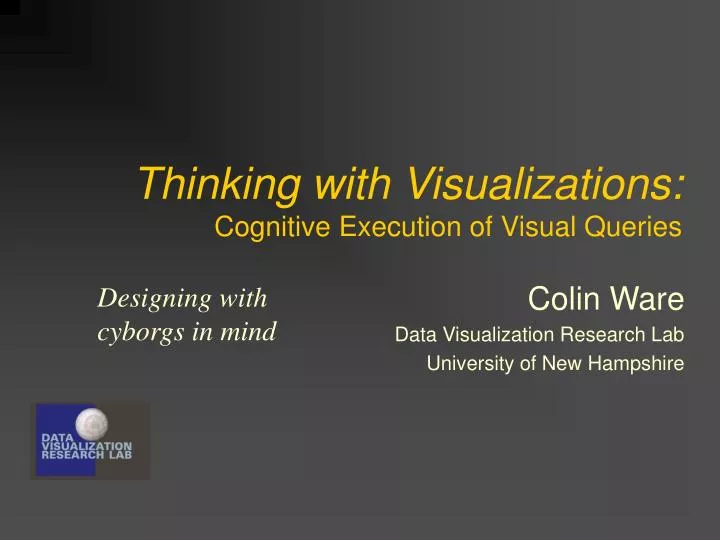
Thinking with Visualizations:Cognitive Execution of Visual Queries Colin Ware Data Visualization Research Lab University of New Hampshire Designing with cyborgs in mind
Architecture for visual thinking 10+ billion neurons Parallel,automatic Interaction Loop
Stage 2 Pattern perception 10 billion neurons Parallel,automatic Interaction Loop
Stage 2 Pattern perceptionVisual queries are executed by finding patterns in displays • Gestalt principles • Proximity • Continuity • Connectedness • Closure
Connection or Relationship Basic patterns Outlier Overlap Groups Uptrend Identity Contrast = quantity Size = quantity
Dual Coding Theory Visual Structural Information Verbal-Propositional Information Baddeley Verbal Working Memory Central Executive Visual Working Memory Visuo-Spatial Sketchpad Visual input Verbal input Words and symbols
Pictures and Words • When should we use a visual display? • What is a visual language?
Visual and verbal pseudo-code • While letters in stack • Take a letter • Put a stamp on it • Put it in the ‘out tray’ While (text in input) { getline; change characters to upper case; write to output; } Visual programming languages have a history of failure
Capacity of visual working memory (Vogal, Woodman, Luck, 2001) 1 second • Task – change detection • Can see 3.3 objects • Each object can be complex
Change Blindness Simons and Levin
Architecture for visual thinking 10 billion neurons Parallel,automatic Selective Tuning Tsotsos Object Files Interaction Loop
Gist Semantic content
Eye movements • Two or three a second • Preserves Context • The screen is a kind of buffer for visual ideas – we cannot see it all at once but we can sample it rapidly
Thinking visuallyEmbedded processes • Define problem and steps to solution • Formulate parts of problem as visual questions/hypotheses • Setup search for patterns • Eye movement control loop • IntraSaccadic Scanning Loop (form objects)
Problem • Trip Port Bou- Calais (5 days 3 cities) • Visual Problem Mayor Highways – Distance < 1.2 min = red smooth path • Eye movements to identify major candidate pathways • Pattern Identification: smooth, red, connected segments / reject non-red-wrong direction • Part solutions into vwm – spatial markers • Parts may be handed to verbal wm
Software Engineering Example - with Graph Representation • Segment Big Module into parts • High Cohesion (semantics) • Low Coupling • Find highly connected subgraphs with minimal links • Scan for candidate patterns • Look for Low connectivity • Look for Semantic similarity (symbols) • Important question: what are relevant pattern that can fit in vwm
Cost of Knowledge • Intra-saccade (0.04 sec) (Query execution) • An eye movement (0.5 sec) < 10 deg : 1 sec> 20 deg. • A hypertext click (1.5 sec but loss of context) • A pan or scroll (3 sec but we don’t get far) • Walking (30 sec. we don’t get far) • Flying (faster can be tuned) • Zooming, fisheye, DragMag
Walking Flying (30 sec +) Naïve view that does not take perception or the cost of action into account. Semnet GraphVisualizer3D ConeTrees
How to navigate large 2 ½D spaces? (Matt Plumlee) Zooming Vs Multiple Windows • Key problem: How can we keep focus and maintain context. • Focus is what we are attending to now. • Context is what we may wish to attend to. • 2 solutions: Zooming, multiple windows
When is zooming better thanmultiple windows • Key insight: Visual working memory is a very limited resource. Only 3 objects GeoZui3D
Cognitive Model (grossly simplified) • Time = setup cost + number of visits*time per visit • Number of visits is a function of number of objects (& visual complexity) • When there are too many multiple visits are needed
Prediction Results As targets (and visual working memory load) increases, multiple Windows become more attractive.
Lessons for design • Tells us when we need extra windows • What do we need to keep on the screen at the same time • Simultaneous vs successive views
Need low cost and low cognitive cost interactions Constellation: Hover queries (Munzner) MEGraph Brushing Dynamic Queries
Architecture for visual thinking Low -Medium level – pattern perception High level vwm and cognitive costs Appropriate representation (words vs images) Navigation costs Interaction Loop
Cognitive Systems • Slogan: “Tighten the loop” • Take a systems approach • Visualization for pattern finding • Take into account the non-homogeneity of space. • Algorithms for pre-filtering • Optimize navigation – brushing, dynamic queries – breadth first range searches • Large high resolution displays
Acknowledgements • NSERC (Canada) • NSF (USA) • NOAA • ARDA
3D versus 2D 11.4% errors 3.7 sec sub-structure 21% errors 5.1 sec sub-structure 20% memory errors 34% memory errors
Research topicWhat are easy visual queries Easy= single object comparison in vwm