Download
1 / 11

E N D
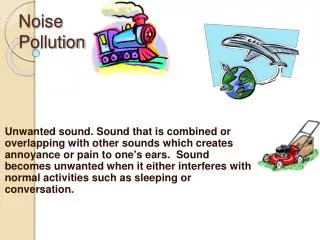
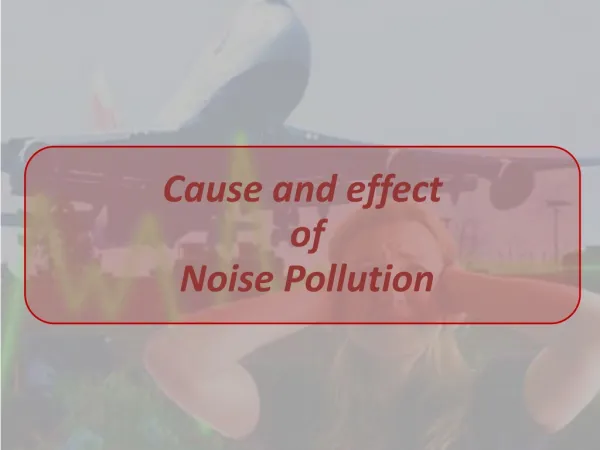
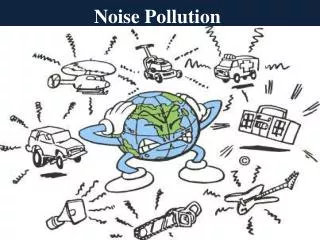
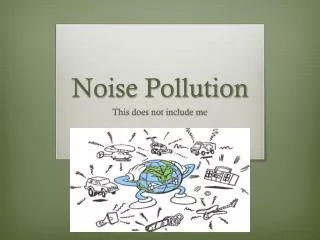
NOISE POLLUTION • Noise has become part of our environment. With progress in industrial growth, the level of noise has been increasing continuously. In the nineteenth century the development of the steam engine, petrol engine and technological machineries in industry resulted in increasingly noisy environment. In the twentieth century this has been further accelerated by introduction of the diesel engine, turbo-prop and jet engines, high tech machineries, construction site machineries and increase roas traffic. Noise is considered to be one of the dimensions of pollution which leads to degradation of the environment and also poses health and communication hazards. • A stated in the previous section, two important parameters of sound/noise are sound pressure and sound intensity. They are measured in different units giving varying scale of magnitude. The common scientific acoustic unit is the decibel (dB). It is a absolute physical unit like volt, meter etc but it is a ration expressed a a logarithmic scale relative to a reference sound pressure level. • 1 decibel (dB) = 10 log 10 (Intensity measured/Reference intensity)
This logarithmic scale takes care of wide range of sound pressure and intensities. The reference intensity used is the threshold of hearing which means sound which can be first heard at a sound pressure of 2 x 10⁻⁵ Newton m-2 or sound intensity of 10-12 Watt m-2. The three measurement units are shown in Table 10.1 for illustrating their relationship.
The dB scale is limited in the sense that it is not related to the human ear frequency response and environmental circumstances in which noise is produced. This has necessitated design of noise measuring meters which reduce the response to low and very high frequencies, characteristic of human ear capacity. These meters record the dBA scale which is commonly used for measurement of general noise levels. However, even the dBA scale is not refined enough to take care of peak noise levels, duration of noise exposure and wuality of noise which are aspects of specific environmental noise situations. That is why other noise meters have been designed, based upon the dBA scale but with proper refinements. Table 11.1 Sound measurement units intensities, pressure and decibel (dB)—for sound in air at room temperature and sea level pressure. L10(18 hour) Index—this is used for road noise measurement, adopted in U.K. for noise legislation. The index is expressed in dBA—it is the arithmetic average hourly values of the noise level exceeded for 10 per cent of the time over 18 hours between 0.600 and 24.00 hours on any normal week day. It includes peak noise values and fluctuation of noise depending on the type of vehicle and traffic density. Equivalent Noise level (Leq)—this is accepted by the International Organisation for Standardisation (ISO) for measurement and rating of noise in resential, industrial and traffic areas. The index implies mean noise lever over a specified period of time. An Leq of 90 dBA means a steady noise level over the whole period of time or noise level steady at 93 dBA for 50 per cent of the time and zero for the remaining period.
NOISE CLASSIFATION • Noise can be broadly classified under three catergories: (Transport noise), (2) Occupational noise, and (3) Neighbourhood noise. • Transport Noise—this can be sub-divided inot (i) Road traffic noise, (ii) Aircraft noise, and (iii) Rail traffic noise. • (i) Road Traffic Noise—Vehicle on roads produce irritation for more people than any other noise source. Traffic noise has been increasing over the year conitinuously. This is because of steady increase of the number of raod vehicles and consequently increases of road traffic density. • Traffic speed is one of the major causes of noise. The noise volume increases with increase in traffic speed. Modern highways and raffic system encourage higher speeds. Road traffic noise varies depending on a number of operating factors of vehicles and also on traffic density and the hour of day. In general, on urban roads there are distinct traffic peaks in the morning and evening as people travel to and from work (e.g. 10:00 hrs and 18:00 hrs). Heavy diesel-engined trucks are the noisest vehicles on roads now. • Traffic noise is accurately measured in dBA and noise levels given on the L10 (18 hour) index.
Road traffic noise levels (U.K.) • The above typical values refer to the situation in U.K. The actual noise limit in force in reseidential area is obviously different in different countries. Thus, the limits for diesel or petrol engine car are 70 dBA in Switzerland and 80 dBA in India. • The Central Pollution Boad (India) has prescribed permissible sound level for cities, divided into four zones.
These noise limits are violated in all big cities in Malaysia. The average noise levels in busy streets are 90 dBA between the rush hours i.e. between 10:30 to 12:00 hrs (noon) and 18:00 to 19:30 hrs. People live in an environment of noise generated by blasting hours, rumbling tyres and screening brakes. Awful road conditions mainly contribute to misery. • (ii) Aircraft Noise—it differs from road raffic noise in the sense that it is not continuous but intermittent. There are peak noise levels when aircrafts fly overhead or take-off and land at airports the noise levels being produced from aircraft as well as the operational height. • The noise limits prescribed by London Heathrow, Gatwick and Ringway Manchester airports for take-off are 110 PNdB during day and 102 PNdB during night (PNdB = Perceived noise level; 1 PNdB = dBA scale + 13). These may be compared with the figure 112 PNdB for day light at New York. New models of aircrafts have been designed with modified aircraft engines so that the level of aircraft noise cab is reduced. There is a trend among aircraft and engine manufacturers to produce quieter power units and air planes. • (iii) Rail Traffic Noise—this is not a serious nuisance as compared to the previous types of traffic noise. The noise is generally of lower frequency than that of street vehicles and furthermore, most railway tracks run through rural areas. Of course, building located beside railway tracks are exposed to noise menace. The introduction of diesel and all-electric locomotives has greatly reduced rai traffic nosie.
(2) Occupational Noise—this is mainly produced by industrial machines and processes which affects millions of people. It also includes noise from domestic gadgets e.g. washing machines, vacuum cleaners etc. Industrial workers are exposed to noise for 8 hours per day and 6 days per week. • Noisy industrial processes and conditions cause hearing loss to the workers involved. Millions of industrial workers are victims of occupational noise for up to 1800 hors per year and for 30 years of their lives. Noise reduction is essential so that workers do not suffer progressive hearing damage, efficiency may be enhanced and accidents are reduced. This would ensure all round improvement in working conditions.
(3) Neighbourhood Noise—this implies variety of sources of noise which disturb and annoy the general public by interfering with their comfort and welfare. Such sources are loud TV and radio sets, loud cassettes, loudspeakers in public functions and entertainment etc. Disco music and dance in late evenings cause noise nuisance to nearby residents.
NOISE HAZARDS Noise is airborn mechanical energy striking the human eardrum. While 65 dB (A) is the level for conservation heard at a distance of one meter, 125 dB (A) gives the sensation of pain in the ear and 150 dB (A) might kill a human being. The most commonly occurring ear damage is brought about by continuous periods of high intensity noise. If a noise level exceeding 90 dB in the mid-frequency range reaches the ear for more than a few minutes, then the sensitivity of the ear is reduce. In addition to progressive hearing loss there may be instantaneous damage or aquatic trauma. This arise from very high intensity impulse type noise due to explosion or sudden excessive noise of about 150 dB or more. Sonic booms or overpressure from supersonic air liners are impulse type noise, which can have hazardous effect on the ears.
Permissible Noise Level-In this age many people work and live in environments where the noise level is not hazardous. But over the years they suffer from progressive hearing loss and psychological hazards including tension. The, aximum permissible noise levels are summarized (Table 11.3). Table 11.3 Maximum permissible noise levels
No. of channels required for a flow length of 255 m = D/Pe = 255/1.875 = 136 No. of channels for each compartment = 136/3 = 46 Length of basin = (46 x 0.75) + (45x 0.075) = 38 m Width of basin = (3x3) + (2x0.15) = 9.3 m