Region IX Nutrient Criteria Program
250 likes | 364 Vues
This meeting report from the National Nutrient Coordinators discusses the complexities in developing nutrient criteria for water bodies. It highlights the natural variability of nutrient levels influenced by geological and biochemical factors and examines the implications of both nutrient deficiency and excess. Key approaches for criteria development are analyzed, including site-specific studies and tiered assessments that emphasize biological responses. The report underscores the importance of using empirical data and modeling tools to understand nutrient impacts and informs management strategies to mitigate impairment of beneficial uses.

Region IX Nutrient Criteria Program
E N D
Presentation Transcript
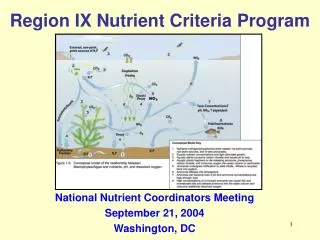
Region IX Nutrient Criteria Program National Nutrient Coordinators Meeting September 21, 2004 Washington, DC
Nutrients: Unique Problems for Criteria Development • Nutrients occur naturally, levels depend on geology and biochemistry • Too little nutrients may be a problem as well as too much • Nutrients themselves generally don’t cause impairment, it’s secondary impacts such as algal growth, impacts on DO that cause concern • Impact depends on other factors, such as light and residence time
Two Extremes for Criteria Development • Site-specific study: • Ideal: reflects characteristics and uses of a waterbody • But, LOE is infeasible • Arbitrary statistical criterion: • Simple, easy to apply • But, high risk (and cost) of classifying supporting waters as impaired
Ecoregion Stream Total Phosphorus (approx. mg/L) 304(a) Criterion Reference 75% % > 304(a) STORET 25% % > 304(a) 1 0.010 0.03 70 0.01 70 5 0.015 0.04 85 0.02 85 6 0.030 0.09 0.06 88 8 0.011 na na 0.002 44 9 0.030 0.13 67 na na 14 0.010 0.03 47 0.03 80 22 0.015 0.07 62 0.02 97 23 0.011 0.06 85 0.005 85 24 0.018 0.07 56 na na 78 0.032 0.05 28 0.12 98 The Importance of “getting it right” 70
Middle Ground: Tiered Approach • Rather than using a single number criterion over a large geographic area, identify sites that are clearly unimpaired (Tier I), clearly impaired (Tier III), or in a gray area between (Tier II), where additional tools are used to assess impairment • Approach falls between the extremes • Use simple analyses, but recognize site-specific characteristics • Identify where more detailed analyses needed • Tier II assessment has the potential to relate nutrient levels to support or impairment of beneficial uses
Modified Strategy for Developing Criteria • Focus on an individual ecoregion, not aggregated ecoregion • Greater emphasis on biological responses to link to protection of beneficial uses • Use statistical and simulation models to provide better estimates of reference loads/concentrations • Use models to predict biological & chemical responses relevant to uses
Concept Designated Use Condition compatible w/ use Nutrient regime to attain condition Mitigating factors for site Criteria Example Aquatic Life support Benthic algal biomass density limit Nutrient linkage (N:P response) Riparian cover, velocity Nutrient limits for site and uses Criteria Exist to Prevent Impairment of Uses
Form of the Standard • Includes chemical and biological parameters • Multiple parameters need to be considered simultaneously • Tier II assessment determines whether combination of factors constitutes impairment
Consequences of Classification • Tier I: No action needed • Tier II: Further study to determine whether beneficial uses are threatened • Site specific factors influencing response • Potential anti-degradation analysis • Tier III: Nutrient load reduction may be needed; possible permit load caps and TMDLs
Tier I/II Breakpoint • Concentration (or load) causing no adverse impact on uses • At or below a percentile of natural background (presumptive approach) • Existing statistical approach • Modeling analysis of natural cover/geology
Tier II/III Breakpoint • Concentration (or load) that presents a clear risk to support of a specific use • Scientific consensus • Modeling analysis • Concentrations at known impaired sites • Set high enough so that misclassification of impairment is at an acceptably low rate
Supporting Toolbox • Detailed empirical analyses by Subecoregion • Tools to relate nutrient concentrations to endpoints that impact designated uses • Tools to evaluate first-cut site-specific modifications to criteria within Tier II
Empirical Data Analysis for Ecoregion 6:NO3 Levels in Streams by Impairment Classification of Water Body
Modeling Natural Background with SWAT • SWAT (Surface Water Assessment Tool) was used to estimate nutrient loads and concentrations in streams. • Designed for use without calibration. • Modified for California climate and vegetation. • A set of eight, relatively unimpaired watersheds was used for validation testing. • Goal: To identify landscape stratification features as directed by RTAG
Chlorophyll-a Concentration (ug/L) Total Nitrogen Loading normalized to lake volume (ug/Year-L, Log Scale) N limited Total Phosphorous Loading normalized to lake volume (ug/Year-L, Log Scale) BATHTUB Model of Lake Response
250 Eutrophic RB 3 Sites as a function of nutrients 200 Mesotrophic 150 100 50 Oligotrophic 0 306MC 308MIL 305THU 314MIG 308LSU 310SLB 305FRA 312BCF 312OFC 312CUY 306CAR 308BSR 309DAV 310ARG 309PSO 304SOQ 315SMC Stream Periphyton Response(equations adopted from QUAL2K)
250 Eutrophic AFDW) 200 2 Mesotrophic 150 100 Maximum Benthic Biomass (g/m 50 Oligotrophic 0 313SAI 315JAL 308LSU 309ATS 304APT 317EST 309NAC 305CHE 306CAR 310CAN 310SCP 309USA 317CHO 309GRN 310BER 309SBR Stream Periphyton Response(equations adopted from QUAL2K) RB 3 Sites as a function of nutrients and light
Fraction of Potential Maximum Periphyton Biomass as a Function of Days of Accrual (Biggs, 2000)
Putting the framework work into practice Hypothetical Scenario for Use of Tiered Criteria Assume following tier boundaries for Total N: Tier I/II 0.1 mg/l Tier II/III 2.0 mg/l For a given concentration in a water body, describe strategies to be adopted with respect to: • Tier I, II, or III classification • Assessment approach • Potential for TMDL listing • Impact on permitting of point source discharges
Next Phases • Recommendations for 305(b) Monitoring: (CA - SWAMP) • Refine / Finalize Assessment Tools • Modeling Framework to Develop Background Nutrient Loading and Concentration Estimates • Training Workshops • Parallel Development of Regional loading, concentration, and bio condition estimates • Development of Tier Boundaries for all Region 9 Ecoregions