Nutrient Criteria Development Advisory Workgroup
Nutrient Criteria Development Advisory Workgroup. Welcome Moderator Director Kelly Holligan Water Quality Planning Division Water Quality Standards Staff Introductions Jim Davenport Laurie Eng Fisher Jason Godeaux Joe Martin Debbie Miller. Pedernales River

Nutrient Criteria Development Advisory Workgroup
E N D
Presentation Transcript
Nutrient Criteria Development Advisory Workgroup Welcome Moderator Director Kelly Holligan Water Quality Planning Division Water Quality Standards Staff Introductions Jim Davenport Laurie Eng Fisher Jason Godeaux Joe Martin Debbie Miller Pedernales River Image by: Texas Water Development Board
Workgroup Process All attendees can participate Handouts and other info will be posted Email communication Written comments standards@tceq.texas.gov
Workgroup Purpose and Goals Input to develop potential options for Numeric Nutrient Criteria (NNC) Review and suggestion analysis For this meeting Current developments in NNC Update on Texas status and plans Discussion
Nutrient Criteria: EPA Guidance EPA and Numerical Nutrient Criteria 1998 mandate: NNC by 2004 Allowed state development plans and schedules – current plan from 2006 National guidance criteria Separate for lakes, streams, reservoirs Pooled for large, aggregate nutrient ecoregions Based on historical data for TP and TN 25th percentile or 75th forunimpactedsites
Nutrient Criteria: Recent Guidance Nutrient Innovations Task Group Report (August 2009) Empirical Approaches for Nutrient Criteria Derivations – SAB Draft (August 2009) SAB review (April 2010) Using Stressor-response Relationships to derive NNC (November 2010) Nutrients in Estuaries (November 2010) Pond covered in Green Algae
Nutrient Criteria: EPA EPA “Speed Up” memo (Ben Grumbles) (May 2007) Lawsuits Florida (July 2008), Wisconsin (Nov. 2009), Kansas (June 2010), possibly more “Go Faster”- EPA Inspector General (August 2009) EPA promulgated NNC for Florida rivers & lakes (November 2010) EPA letter (Tinka Hyde, Region 5) to Illinois (January 2011) EPA response letter (Nancy Stoner) to New England states affirmed NNC must have TP and TN criteria (March 2011) EPA memo (Nancy Stoner) Working in Partnership Memo (March 2011)
EPA Nutrient Criteria: Florida Lawsuit from Florida Wildlife Fed. & others in 2008 Consent decree with EPA in 2009 EPA promulgated criteria for Florida lakes & streams in Nov 2010 - in effect Mar 2012 EPA estuary criteria - propose in Nov 2011; final Aug 2012 Lake Lyndon B. Johnson Image by: Lake Property of Texas
Nutrient Criteria: Florida Lakes & Streams Grouped lakes by color and alkalinity Chlorophyll a (20 – 6 µg/L) Based on Chla for oligotrophic, mesotrophic TP (0.01-0.05 mg/L); TN (0.51-1.27 mg/L) Grouped streams in regions TP (0.06-0.49 mg/L); TN (0.67-1.87 mg/L) Based on reference streams (90th percentile) Stream criteria must protect downstream lakes Down Stream Protection Values EPA allows site-specific adjustments of criteria
Nutrient Criteria: Florida Response Recent countersuits: Florida municipalities and utility districts Florida Fertilizer and Agrichemical Association Florida Agriculture Commissioner Florida DEP: http://www.dep.state.fl.us/water/wqssp/nutrients/ Petitioned withdrawal – April 22 Public meetings – June 14 & 16
Nutrient Criteria: State/National Efforts Other states NNC Alabama – Chla Site specific by Lake Arizona – Chla, TN, TKN, TP, Secchi Lake category Minnesota – TP, Chla, Secchi Lake grouping Oregon – Chla Natural lakes, reservoirs, rivers and estuaries Wisconsin – TP Grouping lake & river Image by: MyManatee.org
Why Are Nutrient Criteria Difficult? Lack of clear “use-based” thresholds for uses such as recreation & aesthetics, aquatic life propagation, drinking water sources Responses to nutrients are highly variable – e.g., effect of TN and TP on Chla No consensus on how to derive criteria Independent criteria or “weight-of evidence”? Insufficiencies in historical monitoring data Initial EPA guidance criteria were problematic High concern about regulatory impacts
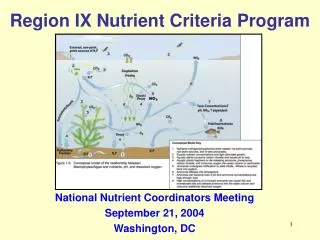
Nutrient Criteria In General Monitoring & research is increasing Potential approaches are becoming defined: Stressor-response evaluations – of what levels of TP, TN cause a significant response in Chla, algal cover, dissolved oxygen swings, fish & invertebrate communities. Defining reference conditions – basing criteria on historical ambient concentrations of nutrients in relatively unimpacted water bodies.
Status of Nutrient Criteria in Texas Development Plan 2010 Adoption of reservoir criteria 2010 Nutrient Implementation Procedures EPA review EPA framework for state nutrient reductions
TCEQ Nutrient Criteria: Development Submitted plans to EPA in 2001, 2006 Reservoirs, then streams & estuaries Convened advisory workgroup Separately for each reservoir Set on historical conditions Proposed for 93 reservoirs - Stand-alone Chla criteria - Chla criteria, + screening levels: TP, transparency New permitting procedures for nutrients
Reservoir Nutrient Criteria - Options Assessed as median Chla, >10 sampling dates Assessed at main pool station or comparable Option 1: Confirm with TP, Transparency values - Calculated same as Chla criteria - Impaired if Chla criterion plus one of the screening criteria are exceeded Option 2: Stand-alone Chla criteria Adopted: Option 2 for 75 reservoirs Lake Palo Pinto Image by: ThisIsBryanOk
Nutrient Criteria: Examples Table that shows an example of nutrient criteria that was proposed in the 2010 Water Quality Standards: • Reservoir - Eagle Mtn; Chla Stand-alone - 25.4 micrograms per liter; TP Not adopted - 0.07 milligrams per liter; Transparency Not adopted - 0.80 meters • Reservoir - Cedar Creek; Chla Stand-alone - 30.4 micrograms per liter; TP Not adopted - 0.07 milligrams per liter; Transparency Not adopted - 0.80 meters • Reservoir - Livingston; Chla Stand-alone - 23.0 micrograms per liter; TP Not adopted - 0.16 milligrams per liter; Transparency Not adopted - 0.67 meters • Reservoir - Lewisville; Chla Stand-alone – 18.5 micrograms per liter; TP Not adopted - 0.06 milligrams per liter; Transparency Not adopted - 0.60 meters • Reservoir - Houston not adopted; Chla Stand-alone – 12.4 micrograms per liter; TP Not adopted - 0.18 milligrams per liter; Transparency Not adopted - 0.28 meters • Reservoir - Travis; Chla Stand-alone – 3.7 micrograms per liter; TP Not adopted - 0.03 milligrams per liter; Transparency Not adopted – 3.13 meters
2010 Nutrient Implementation Procedures In 2010 Standards Implementation Procedures Applied to increases in domestic discharges Sets framework for nutrient (TP) effluent limits Reservoirs – predict effects on “main pool” Reservoirs – assess local impacts - Apply site-specific screening factors - Level of concern – low, moderate, or high - Assess “weight-of-evidence” Streams – assess local impacts (as for reservoirs)
EPA Review WQ Standards Adopted by TCEQ - 6/30/2010 Additional documentation to EPA - 8/4/2011 EPA request for more information regarding nutrient criteria - 5/17/2011 Standards Implementation Procedures Approved by TCEQ 6/30/2010 Comments from EPA 12/2/2010 letter Lake Bridgeport Image by: TRWD
EPA Framework for State Nutrient Reductions EPA Memo from Nancy Stoner, 3/16/2011 Summarizes key elements needed for state programs to reduce nutrient loadings Intended as a flexible planning tool EPA VI has also requested comment and discussion with each state on the framework
Prioritize watersheds on a statewide basis Set watershed load reduction goals Ensure effectiveness of point source permits Agricultural areas Storm water and septic systems Accountability and verification measures Annual public reporting of implementation activities & biannual reporting of load reductions Develop work plan, schedule for numeric criteria EPA Framework for State Nutrient Reductions: Eight Key Elements
Prospects for Developing Additional Nutrient Criteria for Texas Summary of current plans Overview of available data and projects The road ahead: streams and rivers The road ahead: estuaries
Summary of Current Plans Develop criteria option for selected rivers and estuaries based on historical conditions - Individual water bodies - Reference groupings Develop criteria option for streams and rivers based on stressor/response analyses Initiate additional options for estuaries based on ongoing efforts (e.g., stressor/response) Revisit reservoir criteria Consider ways to incorporate weight-of-evidence Develop implementation options
Available Data – Streams and Rivers 30-40 years of data at 100’s of stations, for TP, ~TN, Chla, Transparency, D.O., etc. plus frequent fish, invertebrate sampling Data and Research Needs Algae Sampling – attached periphyton sampling Representative Stations More TN data Lower TP and TN detection limits Recent Projects Dr. Beran, Texas Agrilife Research at Stephenville Dr. Haggard & Dr. Scott, University of Arkansas Dr. Guillen, University Houston Clear Lake Additional studies
Available Data - Estuaries Long-term monitoring stations with decades of data for TP, ~TN, Chl a, Transparency, D.O., Salinity (~ 72 active stations in 2010) Numerous research studies Marine institutes, national estuary programs,TPWD, USGS, TWDB, others Nutrient criteria for Mission-Aransas Estuary UT Marine Science Institute (Dr. Buskey) Nutrient sources/inputs for Galveston Bay, TAMU Galveston (Dr. Quigg) Loading calculations (USGS) Gulf of Mexico Alliance – nutrient team TPWD/TCEQ seagrass sampling Studies on freshwater inflow effects and needs
Available Data - Estuaries Data/research needs More TN data Lower TP and TN detection limits Relationship of TP &TN to Chla, productivity Biological indices for fish, invertebrates Biological responses to nutrient loading Addressing effects of variations in salinity Left: Water Jets Image by: CSTARS Right: A Texas Estuary
Available Data Reservoirs – again… Data/research needs More TN data Lower TP and TN detection limits Representative stations Relationship of TP & TN to Chla, productivity Biological indices and response Main Pool of Lake Travis
The Road Ahead: Streams & Rivers Categorize and group based on Geography? Hydrology? Chemical similarities? Option 1: Base criteria on historical levels in reference streams and rivers Option 2: Stressor/response analyses, relating TN,TP to biological indices, D.O., Chla (in rivers), attached algae (smaller streams)
Streams & Rivers: Challenges Limited data for TN and relative abundance of attached algae Extensive geographic, hydrologic, chemical variability Ideas on applying these options/additional options? Suggestions on how to deal with effluent dominated streams????
The Road Ahead: Estuaries Option 1: Base criteria on historical levels of Chla, TP, TN, transparency at reference sites Option 2: Relate TN, TP to observed responses of parameters such as D.O., Chla Option 3: Incorporate models of nutrient loading/responses (Florida DEP, Chesapeake Bay) Left: Galveston Bay Right: Corpus Christi Bay Images by: NASA
Estuaries: Challenges What defines normal, healthy nutrient loads and water quality for estuaries? Establishing groupings of reference stations difficult Examples of criteria development lacking Remote Sensing of Chlorophyll-a concentrations near Matagorda Bay Image by: Claire Griffin
Estuaries: Challenges cont. Any comments on the nature or resolution of challenges? Focus groups needed for any specific individual estuaries or estuary complexes? Ideas on applying these options /additional options? Texas Mission-Aransas National Estuarine Research Reserve. Image by: NOAA
Conclusion Next Steps and Action Items Final comments Next meeting Webpagewww.tceq.texas.gov/waterquality/standards/stakeholders/nutrient_criteria_group.html Contact Informationstandards@tceq.texas.gov