Download
1 / 11
120 likes | 682 Vues
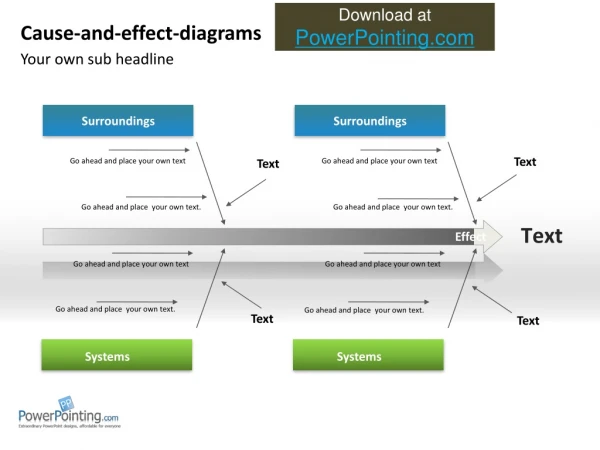
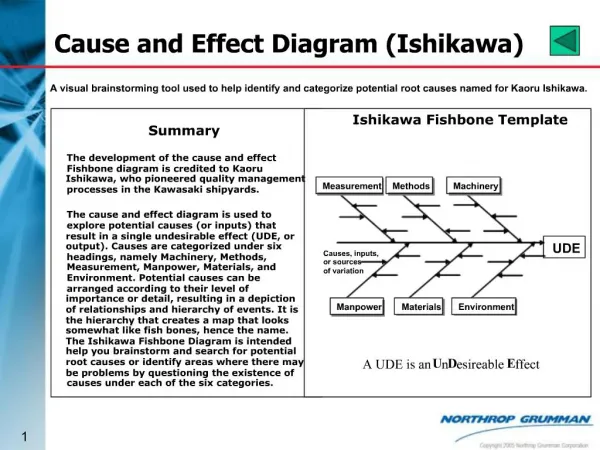
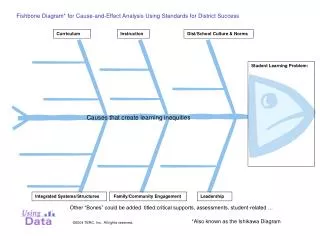
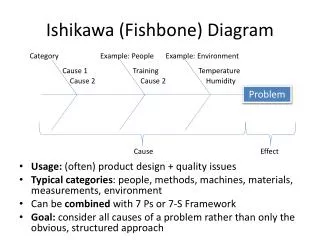
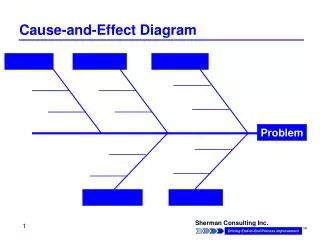
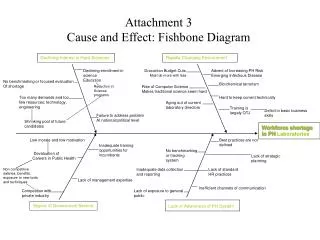
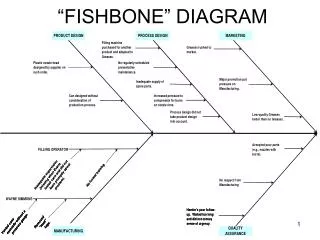
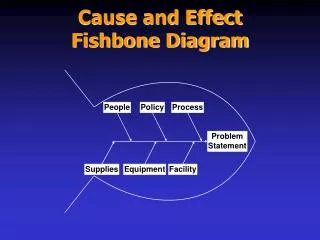
Cause and Effect Fishbone Diagram. Cause and Effect Common Pitfalls. Does not substitute for data. Cause and Effect Common Pitfalls. Does not substitute for data Solution => Continue with your defined data collection Use Multi-voting to select high priority problems.

E N D
Cause and EffectCommon Pitfalls • Does not substitute for data
Cause and EffectCommon Pitfalls • Does not substitute for data • Solution => • Continue with your defined data collection • Use Multi-voting to select high priority problems
Cause and EffectCommon Pitfalls • Begins identifying symptoms before a problem has been analyzed and stated
Cause and EffectCommon Pitfalls • Begins identifying symptoms before a problem has been analyzed and stated • Solution => • Flowchart your current process • Capture problems on fishbone as you go
Cause and EffectCommon Pitfalls • Limits the theories to those identified
Cause and EffectCommon Pitfalls • Limits the theories to those identified • Solution => Continue to update fishbone diagram, or issues list
Multi-voting • Each person gets 10 points • Assign points to the causes • Rank the causes in order • Leave all causes on the list