“FISHBONE” DIAGRAM
230 likes | 1.93k Vues
“FISHBONE” DIAGRAM. THE RANGE OF QUALITY. Quality (or lack thereof) is the result of many decisions made by many persons over a long period of time. SUMMARY OF HANK KOLB CASE. The dimensions of quality and their strategic implications.

“FISHBONE” DIAGRAM
E N D
Presentation Transcript
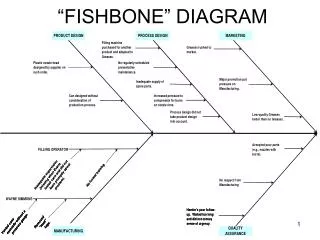
THE RANGE OF QUALITY Quality (or lack thereof) is the result of many decisions made by many persons over a long period of time.
SUMMARY OF HANK KOLB CASE • The dimensions of quality and their strategic implications. • The systemic nature of quality. Quality (or lack thereof) is the result of many decisions made by many persons over a long period of time. • The need for a match between product design and process design. • Use of a Fishbone Diagram. • The degree of integration required to prevent or solve quality-related problems – both “horizontally” and “vertically”. • The requirement of leadership from upper management to change an organization’s view about quality and to implement a quality improvement initiative.