Phase Diagram
Phase Diagram. Is a graphical representation of the conditions of temperature and pressure at which solids, liquids and gases exist. It may exist either as single phases or states of matter or two or more phases in equilibrium with one another. Phase Diagram for Iodine. Phase Diagrams.


Phase Diagram
E N D
Presentation Transcript
Phase Diagram Is a graphical representation of the conditions of temperature and pressure at which solids, liquids and gases exist. It may exist either as single phases or states of matter or two or more phases in equilibrium with one another.
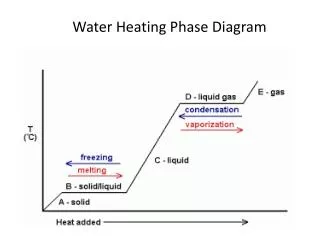
Phase Diagrams Phase diagrams display the state of a substance at various pressures and temperatures and the places where equilibria exist between phases.
Phase Diagrams • The AB line is the liquid-vapor interface. • It starts at the triple point (A), the point at which all three states are in equilibrium.
Phase Diagrams It ends at the critical point (B); above this critical temperature and critical pressure the liquid and vapor are indistinguishable from each other.
Phase Diagrams Each point along this line is the boiling point of the substance at that pressure.
Phase Diagrams • The AD line is the interface between liquid and solid. • The melting point at each pressure can be found along this line.
Phase Diagrams • Below A the substance cannot exist in the liquid state. • Along the AC line the solid and gas phases are in equilibrium; the sublimation point at each pressure is along this line.
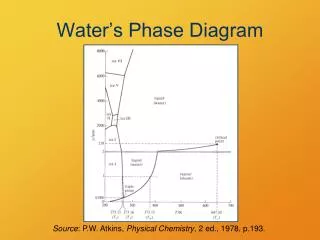
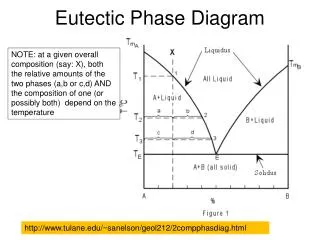
- The curve OC is the vapor pressure curve of liquid iodine, and C is the critical point. • - OB is the sublimation curve of solid iodine. • - The curve OD is the fusion curve. • - The point O has a special significance and thus called the triple point.
A line at P=1atm intersects the sublimation curve, not the vapor curve. • A solid CO2 sublimes at a constant temperature of -78.5 o, when heated in an open container. • For CO2 to exist as a liquid, the pressure must exceed at 5.11atm.
SUPERCRITICAL FLUIDS • - A supercritical fluid is any substance at a temperature and pressure above its thermodynamiccritical point. It has the unique ability to diffuse through solids like a gas, and dissolve materials like a liquid. Additionally, it can readily change in density upon minor changes in temperature or pressure.
The fusion curve OD has a negative slope, that is, it slopes toward the pressure axis. • The melting point of water decreases with increasing pressure.
PHASE versus STATE OF MATTER • The state of matter is composed of solid, liquid and gas. • A phase is any sample of matter with definite composition and uniform properties that is distinguishable from other phases with which it is contact.
Van der Waals Forces Instantaneous & Induced Dipole • a displacement of the electronic charge Instantaneous dipole with a charge separation represented as + and -. • The instantaneous dipole on the left induces a charge separation in the molecule on the right. And this result to a dipole-dipole attraction.
Dispersion forces become stronger as polarizability increases, molecules attract each other more strongly, with the result that melting and boiling points of covalent substances generally increase with increasing molecular mass. • The strength of dispersion forces also depends on molecular shape. Electrons in elongated molecules are more easily displaced than are those in small, compact, symmetrical molecules.
In a polar substance, the molecules have permanent dipole moments. The results is that the molecules try to line up with the positive end of one dipole directed toward the negative ends of neighboring dipoles.
Summary of Van der Waals Forces: • Dispersion (London) forces involve displacements of all the electrons in molecules. The strengths of these forces increase with increased molecular mass and also depend on molecular shapes. • Forces associated with permanent dipoles involve displacements of electron pairs in bonds rather than in molecules as a whole.
When comparing substances of roughly comparable molecular masses, dipole forces can produce significant differences in such properties as melting point, boiling point and enthalpy of vaporization. • When comparing substances of widely different molecular masses, dispersion forces are usually more significant than dipole forces.
The alignment of HF dipoles places an H atom between two F atoms. Because of the very small size of the H atom, the dipoles come close together and produce strong dipole – dipole attractions. • Although an H atom is covalently bonded to one F atom, it is also weakly bonded to the F atom of a nearby HF molecule.
The bond angle between two nonmetal atoms bridged by an H atom is about (that is, the bond angle, F-H----F) 180o.
Hydrogen bonding is formed when an H atom bonded to one highly electronegative atom is simultaneously attracted to a highly electronegative atom of a neighboring molecule. • Hydrogen bonds are possible only with certain hydrogen containing compounds.
HYDROGEN BONDING IN WATER The crystal structure of ice
H atoms lie between pairs of O atoms, again closer to one O atom than to the other. Molecules behind the plane of the page are shaded light blue. O atoms are arranged in bent hexagonal rings arranged in layers. This characteristic pattern is revealed in the hexagonal shapes of snowflakes. • Hydrogen bonding can also be seen in some unexpected properties of other compounds such us the acetic acid.