Chap.1. Phase and Phase Diagram
90 likes | 383 Vues
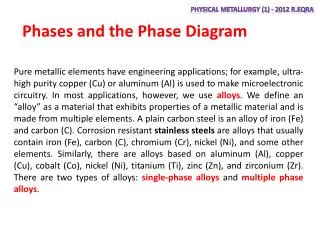
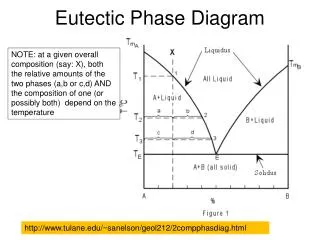
Chap.1. Phase and Phase Diagram. Phase( 상 ) : Any material system usually contains regions which exhibit same properties such as specific volume, composition and structure, and distinguished from other regions by an identifiable interface, called “ phase ”

Chap.1. Phase and Phase Diagram
E N D
Presentation Transcript
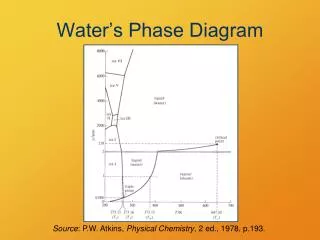
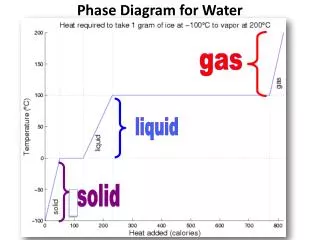
Chap.1. Phase and Phase Diagram • Phase(상): Any material system usually contains regions which exhibit same properties such as specific volume, composition and structure, and distinguished from other regions by an identifiable interface, called “phase” * Even one component system can have many phases, and multi component system can have a fewer phases. • Materials Properties: depend much on the nature, number, amount and forms of various possible phases present and can be changed by alterations in these quantities. ⇒ vital to know the conditions under which any given system will exist in its various possible forms. • (Equilibrium) Phase Diagrams( 평형 상태도) : plot of most stable phases that occur under equilibrium state of a system as a function of temperature, pressure and composition for various material systems. * Equilibrium state(평형 상태): properties of the system will not change with time unless alteration in state variables such as temperature, pressure and/or composition occurs. * mostly empirical but based firmly on thermodynamic principles.
Fe-C(or Fe-Fe3C) Equilibrium phaseDiagram • Guide for heat treatment of steels. - Modification due to alloying and deviation from equilibrium state. - Graphite is more stable form than Fe3C but graphitization rarely occur in steels → Fe-Fe3C diagram is more pertinent. - In cast irons(>2%C), high carbon and high Si addition promote graphite formation →Fe-C diagram is more valid - Valid at 1 atm. - wt%⁄at% conversion: at.%C =C atoms/(C atoms+Fe atoms)x100 =(wt%C/at.wtC)/(wt%C/at.wtC+wt%Fe/at.wtFe)x100 • Phases present - Ferrite ( α- iron): BCC ; a =2.86A0 , - Austenite (γ-iron) : FCC: a = 3.56A0 - Delta Ferrite: BCC formed near to meltingtemperature due to inter-dendritic segregation of alloying or impurity - Cementite(Fe3C):orthorhombic;a=4.52A0, b=5.09A0,c=6.74A0, Contains 12 Fe-atoms and 4 C-atoms
Effects of Carbon • Interstitial solid solution element in steels - stabilizes austenite. - max. solubility of carbon in austenite is 2.11% at 1148 0C and in ferrite is only 0.02% at 7270C - When solubility limit for carbon in austenite and ferrite is exceeded, iron carbide or cementite(Fe3C) forms. • Interstitial sites - Two types in bcc and fcc : Octahedral and Tetrahedralsites : Fig.1.5 & 1.6 - In austenite, an octahedral site can accommodate an atom of 0.052nm in radius, tetrahedral site 0.028nm. - In Ferrite a tetrahedral site can accommodate an interstitial atom of 0.035nm in radius and the octahedral site 0.019nm in radius. - carbon atoms have radii of 0.07nm and are therefore more readily accommodated in the octahedral site of austenite and are less soluble in ferrite. - The octahedral site in ferrite are not symmetrical and carbon atoms prefer the octahedral sites by displacing two atoms at a distance of a/2. - Rapid cooling from austenite to ferrite produce a severe distortion of the lattice by carbon atoms, altering the cube structure to tetragonsl structure (Martensitic transformation)
Effects of alloying Elements • Alloying elements and impurities: Mn, Cr, Mo, W, Cr, P, C, N etc. - Each alloying element, itself or collaborating with other element exert different effects. - Austenite stabilizer: widens the temperature range for stable austenite by depressing the α-γ transformation and raising the γ-δ transformation. * Type 1: Forms no iron-rich compounds: Mn, Ni, Co, etc. * Type 2: Forms iron-rich compounds: Cu, Zn, Au, N and C, etc. - Ferrite stabilizer: Narrows temperature range for stable austenite * Type 1:Austenite zone is completelysurrounded bya two phase (α+γ or γ+δ) field : Si, Cr, W, Mo, P, V, T, Be, Sn,Sb, As, Al * Type 2:Intermetallic compounds or other constituents appear: Ta, Zr, B, S, Ce, Cb
Critical (Transformation) Temperatures • Critical (Transformation) Temperatures - Al(or Ael): Boundary between α+ Fe3C와 α+γ or γ+ Fe3C, - A3 : α+γ와 γ - Acm (Aecm): γ와 γ+Fe3C - The transformations are diffusion controlled → sensitive to composition and heating/cooling rate. - Ac : on heating, Ar : on cooling • Experimentally determined by measuring changes in heat transfer(DTA) or dimension(Dilatometer) - On heating, heat absorption and shrinkage occur as ferrite transforms into close packed austenite. - On cooling, the reverse occur. - Can be calculated using thermodynamic data • Alloying effects on transformation can be formulated. - e.g. Ac1= 723-10.7Mn-16.9Ni+29.1Si+16.9Cr+290As+6.38W * austenite stabilizer : negative sign, ferrite stabilizer : positive sign