Phases and the Phase Diagram
620 likes | 1.17k Vues
Physical Metallurgy (1) - 2012 R.Eqra. Phases and the Phase Diagram.

Phases and the Phase Diagram
E N D
Presentation Transcript
Physical Metallurgy (1) - 2012 R.Eqra Phases and the Phase Diagram Pure metallic elements have engineering applications; for example, ultra-high purity copper (Cu) or aluminum (Al) is used to make microelectronic circuitry. In most applications, however, we use alloys. We define an “alloy” as a material that exhibits properties of a metallic material and is made from multiple elements. A plain carbon steel is an alloy of iron (Fe) and carbon (C). Corrosion resistant stainless steels are alloys that usually contain iron (Fe), carbon (C), chromium (Cr), nickel (Ni), and some other elements. Similarly, there are alloys based on aluminum (Al), copper (Cu), cobalt (Co), nickel (Ni), titanium (Ti), zinc (Zn), and zirconium (Zr). There are two types of alloys: single-phase alloys and multiple phase alloys.
Physical Metallurgy (1) - 2012 R.Eqra The understanding of phase diagrams for alloy systems is extremely important because there is a strong correlation between microstructure and mechanical properties, and the development of microstructure of an alloy is related to the characteristics of its phase diagram. In addition, phase diagrams provide valuable information about melting, casting, crystallization, and other phenomena unary phase diagram one-component phase diagram (or unary phase diagram) [sometimes also called a pressure–temperature (or P–T) diagram] is represented as a two dimensional plot of pressure (vertical axis) versus temperature ( horizontal axis)
Physical Metallurgy (1) - 2012 R.Eqra Pressure–temperature phase diagram for H2O. Intersection of the dashed horizontal line at 1 atm pressure with the solid–liquid phase boundary (point 2) corresponds to the melting point at this pressure (T 0C). Similarly, point 3, the intersection with the liquid–vapor boundary, represents the boiling point (T 100C).
Physical Metallurgy (1) - 2012 R.Eqra Schematic unary phase diagram for magnesium, showing the melting and boiling temperatures at one atmosphere pressure. On this diagram, point X is the triple point
Physical Metallurgy (1) - 2012 R.Eqra BINARY ISOMORPHOUS SYSTEMS
Physical Metallurgy (1) - 2012 R.Eqra (a) The copper–nickel phase diagram. (b) A portion of the copper nickel phase diagram for which compositions and phase amounts are determined at point B. (Adapted from Phase Diagrams of Binary Nickel Alloys, P. Nash, Editor, 1991. Reprinted by permission of ASM International, Materials Park, OH.)
Physical Metallurgy (1) - 2012 R.Eqra Figure 10-12
Physical Metallurgy (1) - 2012 R.Eqra Lever Rule Derivation (mass balance)
Physical Metallurgy (1) - 2012 R.Eqra Equilibrium Cooling
Physical Metallurgy (1) - 2012 R.Eqra Schematic representation of the development of microstructure duringthe equilibrium solidification of a 35 wt% Ni–65 wt% Cu alloy.
Physical Metallurgy (1) - 2012 R.Eqra Nonequilibrium Cooling
Physical Metallurgy (1) - 2012 R.Eqra Schematic representation of the development of microstructure during the nonequilibrium solidification of a 35 wt% Ni–65 wt% Cu alloy.
Physical Metallurgy (1) - 2012 R.Eqra Figure 10-17 The change in structure of a Cu 40% Ni alloy during nonequilibriumsolidification. Insufficient time for diffusion in the solid produces a segregated structure. Notice the nonequilibrium solidus curve
Physical Metallurgy (1) - 2012 R.Eqra To summarize Nonequilibriumcooling results in an increased temperature range over which liquid and solid are present; Final solidification occurs at a lower temperature than predicted by the phase diagram; The final liquid to solidify will be richer in the lower-meltinq-point metal; and since diffusion has not kept pace with crystal growth. There will be a difference in chemical composition from the centerto the outside of the grains. The faster the rate of cooling. the greater will be the above effects
Physical Metallurgy (1) - 2012 R.Eqra Homogenization Cored structures are most common in as-cast metals From the discussion of the origin of a cored structure. it is apparent that the last solid formed along the grain boundaries and in the interdendriticspaces is very rich in the lower-melting-point metal. Depending upon the properties of this lower-melting-point metal, the grain boundaries may act as a plane of weakness. It will also result in a serious lack of uniformity in mechanical and physical properties and, in some cases, increased susceptibility to intergranular corrosion because of preferential attack by a corrosive medium. Therefore, for some applications, a cored structure is objectionable
Physical Metallurgy (1) - 2012 R.Eqra There are two methods for solving the problem of coring One is to prevent its formation by slow freezing from the liquid, but this results in large grain size and requires a very long time. The preferred method industrially is to achieve equalization of composition or homogenization of the cored structure by diffusion in the solid state Diffusion Diffusion refers to the net flux of any species, such as ions, atoms, electrons, holes and molecules. The magnitude of this flux depends upon the concentration gradient and temperature.
Physical Metallurgy (1) - 2012 R.Eqra Rate of Diffusion [Fick’s First Law] The rate at which atoms, ions, particles or other species diffuse in a material can be measured by the flux J The flux J is defined as the number of atoms passing through a plane of unit area per unit time. Fick’s first law explains the net flux of atoms:
Physical Metallurgy (1) - 2012 R.Eqra Temperature and the Diffusion Coefficient The kinetics of diffusion are strongly dependent on temperature. The diffusion coefficient D is related Composition Profile [Fick’s Second Law] Fick’s second law, which describes the dynamic, or non-steady state, diffusion of atoms, is the differential equation For example
Physical Metallurgy (1) - 2012 R.Eqra Mechanisms for Diffusion
Physical Metallurgy (1) - 2012 R.Eqra MECHANICAL PROPERTIES OF ISOMORPHOUS ALLOYS For the copper–nickel system, (a) tensile strength versus composition, and (b) ductility (%EL) versus composition at room temperature. A solid solution exists over all compositions for this system.
Physical Metallurgy (1) - 2012 R.Eqra CONGRUENT PHASE TRANSFORMATIONS
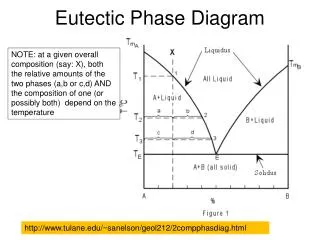
Physical Metallurgy (1) - 2012 R.Eqra (a) Using this diagram, briefly explain how spreading salt on ice that is at a temperature below 0°C (32°F) can cause the ice to melt. (b) At what temperature is salt no longer useful in causing ice to melt?
Physical Metallurgy (1) - 2012 R.Eqra BINARY EUTECTIC SYSTEMS The copper–silver phase diagram. [Adapted from Binary Alloy Phase Diagrams, 2nd edition, Vol. 1, T. B. Massalski (Editor-in-Chief), 1990. Reprinted by permission of ASM International, Materials Park, OH.]
Physical Metallurgy (1) - 2012 R.Eqra The lead–tin phase diagram. [Adapted from Binary Alloy Phase Diagrams, 2nd edition, Vol. 3, T. B. Massalski (Editor-in-Chief), 1990. Reprinted by permission of ASM International, Materials Park, OH.
Physical Metallurgy (1) - 2012 R.Eqra DEVELOPMENT OF MICROSTRUCTURE IN EUTECTIC ALLOYS Schematic representations of the equilibrium microstructures for a lead–tin alloy of compositionC1 as it is cooled from the liquid-phase region
Physical Metallurgy (1) - 2012 R.Eqra Schematic representations of the equilibrium microstructures for a lead–tin alloy of composition C2 as it is cooled from the liquidphase region.
Physical Metallurgy (1) - 2012 R.Eqra Schematic representations of the equilibrium microstructures for a lead–tin alloy ofeutectic compositionC3 above and belowthe eutectic temperature
Physical Metallurgy (1) - 2012 R.Eqra Schematic representations of the equilibrium microstructures for a lead–tin alloy of composition C4 as it is cooled from the liquid-phase region
Physical Metallurgy (1) - 2012 R.Eqra Age hardening, or precipitation hardening, is produced by a sequence of phase transformations that leads to a uniform dispersion of nanoscale, coherent precipitates in a softer, more ductile matrix Age or Precipitation Hardening Step 1: Solution Treatment In the solution treatment, the alloy is first heated above the solvus temperature and held until a homogeneous solid solution α is produced Step 2: Quench After solution treatment, the alloy, which contains only α in its structure, is rapidly cooled, or quenched. The atoms do not have time to diffuse to potential nucleation sites, so the θdoes not form supersaturated solid solution αsscontaining excess copper, and it is not an equilibrium structure. It is a metastable structure
Step 3: Age Finally, the supersaturated is heated at a temperature below the solvustemperature. At this aging temperature, atoms diffuse only short distances. Because the supersaturated is metastable, the extra copper atoms diffuse to numerous nucleation sites and precipitates grow. Eventually, if we hold the alloy for a sufficient time at the aging temperature, the equilibrium structure α+θis produced Physical Metallurgy (1) - 2012 R.Eqra
Coherent Precipitate Even if we produce a uniform distribution of discontinuous precipitate, the precipitate may not significantly disrupt the surrounding matrix structure (noncoherent)[Figure (a)]. Consequently, the precipitate blocks slip only if it lies directly in the path of the dislocation. When a coherent precipitate forms, the planes of atoms in the crystal structure of the precipitate are related to—or even continuous with—the planes in the crystal structure of the matrix [Figure (b)]. Now a widespread disruption of the matrix crystal structure is created, and the movement of a dislocation is impeded even if the dislocation merely passes near the coherent precipitate. A special heat treatment, such as age hardening, may produce the coherent precipitate. Physical Metallurgy (1) - 2012 R.Eqra