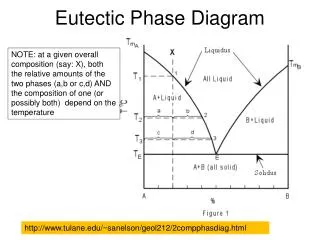
Phase Diagram
Phase Diagram. Development Of Microstructure. DEVELOPMENT OF MICROSTRUCTURE IN ISOMORPHOUS ALLOYS Equilibrium Cooling. Cooling occurs very slowly, in that phase equilibrium is continuously maintained.


Phase Diagram
E N D
Presentation Transcript
Phase Diagram Development Of Microstructure
DEVELOPMENT OF MICROSTRUCTURE INISOMORPHOUS ALLOYSEquilibrium Cooling • Cooling occurs very slowly, in that phase equilibrium is continuously maintained. • Let us consider the copper–nickel system, specifically an alloy of composition 35 wt% Ni–65 wt% Cu as it is cooled from 1300˚C.
Schematic representation of the development of microstructure during the equilibrium solidification of a 35 wt% Ni–65 wt% Cu alloy
At 1300˚C, point a, the alloy is completely liquid (of composition 35 wt% Ni–65 wt% Cu) • Point b, ~1260˚C the first solid α begins to form, which has a composition dictated by the tie line drawn at this temperature [i.e., 46 wt% Ni–54 wt% Cu, noted as α (46 Ni)] • The composition of liquid is still approximately 35 wt% Ni–65 wt% Cu [L(35 Ni)] • At 1250˚C, point c, the compositions of the liquid and α phases are 32 wt% Ni–68 wt% Cu [L(32 Ni)] and 43 wt% Ni–57 wt% Cu [α(43 Ni)], respectively. • The solidification process is virtually complete at about 1220˚C, point d; the com-position of the solid α is approximately 35 wt% Ni–65 wt% Cu • The last remaining liquid is 24 wt% Ni–76 wt% Cu • Upon crossing the solidus line, this remaining liquid solidifies
Non equilibrium Cooling • Conditions of equilibrium solidification and the development of microstructures, as described in the previous section, are realized only for extremely slow cooling rates. • The reason for this is that with changes in temperature, there must be readjustments in the compositions of the liquid and solid phases • These readjustments are accomplished by diffusional processes • Diffusion is a time-dependent phenomenon • To maintain equilibrium during cooling, sufficient time must be allowed at each temperature for the appropriate compositional readjustments.
Let us begin cooling from a temperature of about 1300˚C; this is indicated by point a in the liquid region. This liquid has composition of 35 wt% Ni–65 wt% Cu. • At point b (approximately 1260˚C), α-phase particles begin to form, which, from the tie line constructed, have a composition of 46 wt% Ni–54 wt% Cu. • Upon further cooling to point c (about 1240˚C), the liquid composition has shifted to 29 wt% Ni–71 wt% Cu; furthermore, at this temperature the composition of the α phase that solidified is 40 wt% Ni–60 wt% Cu. • However, because of diffusion in the solid α phase is relatively slow, the α phase that formed at point b has not changed composition appreciably—that is, it is still about 46 wt% Ni—and the composition of the α grains has continuously changed with radial position, from 46 wt% Ni at grain centers to 40 wt% Ni at the outer grain perimeters.
At point d (~1220˚C) and for equilibrium cooling rates, solidification should be completed. However, for this non equilibrium situation, there is still an appreciable proportion of liquid remaining, and the α phase that is forming has a composition of 35 wt% Ni also the average α-phase composition at this point is 38 wt%. • Non equilibrium solidification finally reaches completion at point e (~1205˚C). The composition of the last α phase to solidify at this point is about 31 wt% Ni; the average composition of the α phase at complete solidification is 35 wt% Ni. • The inset at point f shows the microstructure of the totally solid material.
Consequences under non equilibrium conditions. • Segregation- Concentration gradients are established across the grains (the distribution of the two elements within the grains is no uniform) • Coring- The center of each grain, which is the first part to freeze, is rich in the high-melting element (e.g., nickel for this Cu–Ni sys-tem), whereas the concentration of the low-melting element increases with position from this region to the grain boundary.