Phase Diagram
Phase Diagram. Is a graphical representation of the phases of a substance as a function of temperature and pressure. Consists of three discrete regions that represent different phases (s, l, or g) exhibited by a substance


Phase Diagram
E N D
Presentation Transcript
Phase Diagram • Is a graphical representation of the phases of a substance as a function of temperature and pressure. • Consists of three discrete regions that represent different phases (s, l, or g) exhibited by a substance • Each region corresponds to range of combinations of T and P over which that phase is stable
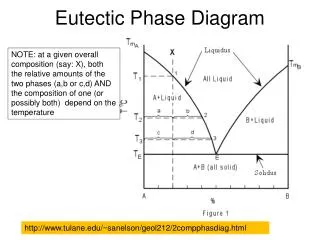
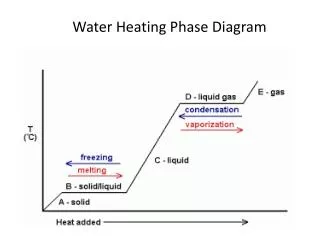
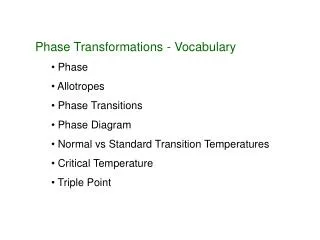
Phase Diagram The triple point (T)is the pressure and temperature at which all three phases of a substance are in equilibrium. Normal melting point (MP):is the temperature at which the solid and liquid are at equilibrium at P = 1 atm or 760 mm Hg Normal boiling point (BP):is the temperature at which the liquid and gas are at equilibrium at P = 1 atm or 760 mm Hg Freezing/meltingis the phase change that occurs on the line between the solid phase and the liquid phase. Evaporation/condensationis the change that occurs on the line between the liquid and the gas phase. Sublimation/depositionis the phase change that occurs on the line between the solid and gas phase.
Critical Temperature and Critical Pressure • Critical temperature (C) is the highest temperature at which a liquid can exist • At the critical temperature or higher temperatures, the gas cannot be condensed to a liquid, no matter how high the pressure gets • Critical pressure: pressure required to liquefy AT the critical temperature. • Critical point: critical temperature and pressure • E.g. SO2(critical point: 158°C, 78 atm) • SO2 can be liquefied at various P as long as T is below 158 °C • At the critical point, the liquid and gas phases have exactly the same density, and only a single phase exists. This single phase is called a supercritical fluid, which exhibits many of the properties of a gas but has a density more typical of a liquid.
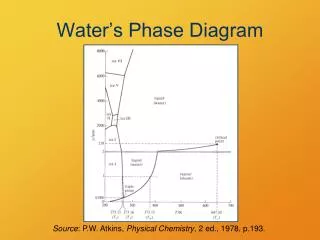
Phase Diagram of Water • Note the high critical temperature and critical pressure (due to the strong intermolecular forces between water molecules). • Melting curve is slightly slanting to the left indicating that the m.p decreases with increase in P. • Below the P of 0.00603 atm, ice sublimes to water vapor on heating. • This property is used to freeze dry foods and beverages. • Food or beverage is frozen below 0°C. Next it is placed in a chamber with P below 0.00603 atm and then warmed so that water in the food sublimes, leaving behind the dehydrated food or beverage.
Phase Diagram of Carbon Dioxide • Carbon dioxide cannot exist in the liquid state at pressures below 5.11 atm; CO2 sublimes at normal pressures. • This makes solid CO2 (dry ice) a coolant because it sublimes rather than melts as it absorbs energy at ordinary pressures.
Sketching a Phase Diagram The normal melting and boiling points of a substance are 18 °C and 40 °C respectively, and its triple point is 10 °C and 380 mm Hg. Sketch the phase diagram for the substance, showing the three points given above and indicating the area in which each phase is stable.
Practice: Phase Diagram • 1) The substance is at ________ phase at 1.5 atm and 200 °C. • 2) The point ______ on the diagram is where liquid and gas phases of the substance are at equilibrium at the normal boiling point. • 3) The line CA represents _____________________. • 4) The line IC represents _______________________. • 5) The normal melting point is indicated by the letter _____.
Practice: Phase Diagrams 1. The normal boiling point of a substance is 78 °C. In what state it would exist at: • 78˚C and 0.8 atm _____ b) 78˚C and 1.2 atm ______ • 95˚C and 1.0 atm _____ d) 65˚C and 1.0 atm ______ 2) Which of the following substance can be liquefied at 50°C? (Hint: the given T must be < Critical T) a) CH3Cl (critical point: 144˚C, 66 atm) b) C2H2 (critical point: 36˚C, 62 atm) c) CH4 (critical point: -82˚C, 46 atm)