Download

1 / 24
240 likes | 376 Vues
Refinement of the Missouri Corn Nitrogen Algorithm Using Canopy Reflectance. Newell Kitchen, Ken Sudduth, and Scott Drummond USDA-Agricultural Research Service Peter Scharf, Harlan Palm, and Kent Shannon University of Missouri. Active-light Reflectance Sensing.

E N D
Refinement of the Missouri Corn Nitrogen Algorithm Using Canopy Reflectance Newell Kitchen, Ken Sudduth, and Scott Drummond USDA-Agricultural Research Service Peter Scharf, Harlan Palm, and Kent Shannon University of Missouri
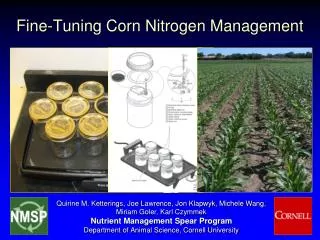
Active-light Reflectance Sensing Objective: To assess on different Missouri soils the use of active crop-canopy reflectance sensors for assessing corn N need and developing algorithms for optimizing economic returns with variable-rate N fertilizer application.
Methods • A total of 16 field-scale experiments were conducted over four growing seasons (2004-2007) • These fields represented three major soil areas of Missouri: river alluvium, deep loess, and claypan. • Multiple blocks of N randomized rate response plots were arranged end-to-end so that blocks traversed the length of each field. Each block consisted of 8 N treatments from 0 to 235 kg N/ha on 34 kg N/ha increments, top-dressed sometime between vegetative growth stages V7 and V11
For 2006 and 2007, a complete second set of field-length blocks were also established where 67 kg N/ha was uniformly applied over the set of blocks shortly after corn emergence. • Adjacent to and on both sides of the response blocks, N-rich (235 kg N/ha) reference strips were also established. These ran the full length of the field and were treated shortly after corn emergence.
An AGCO Spra-Coupe (AGCO Corp., Duluth, GA) high-clearance applicator equipped with an AGCO FieldStar Controller was used to top-dress between corn rows solution UAN (28 or 32% N) fertilizer for the N rate treatments.
Crop canopy reflectance sensor (Crop Circle model ACS-210, Holland Scientific, Inc., Lincoln, NE) measurements were obtained from the corn canopy of the N response blocks at the same time the Spra-Coupe was used to apply N rate treatments. • On the same day reflectance sensor measurements were also obtained from the N-rich reference strips.
Data analysis for these field studies included four major steps: 1) Determining optimal N with quadratic-plateau modeling 2) Processing of canopy reflectance senor data from response plots and the N-rich reference areas 3) Relating modeled optimal N from step 1 with sensor measurements from step 2 4) Developing optimized-profit algorithms relative to conventional producer N rates
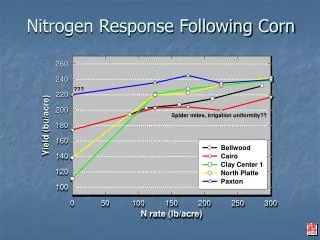
Optimal N Rate as a Function of Canopy Reflectance
Optimal N Rate as a Function of Canopy Reflectance
Developing Optimized-profit Algorithms Relative To Conventional Producer N Rates Inputs: • Values and quadratic response curves from optimal N rate modeling • Field-measured SI values for each response block • A set price of corn grain and N fertilizer • A producer prescribed N rate for each site-year Variables that were optimized during the iterative phase included: • Slope and intercept values for the N recommendation, based on the equation: Nrec = a(1/SI) + b (SI = sufficiency index) • The minimum N rate to be applied by the algorithm • The maximum N rate to be applied by the algorithm The analysis was repeated on 12 subsets of data, based upon factorial combinations of the following two variables: • Three soil types & all soils combined • N applied at planting (0 kg N/ha, 67 kg N/ha, both combined)
Fertilizer To Grain Ratio (FGR) Using SI Units For Various Combinations Of N Fertilizer And Corn Grain Prices
General Shape of N Algorithm Maximum N Increasing N Minimum N
Optimal N Rate as a Function of Canopy Reflectance
Profit Potential Using the Canopy Sensors And Derived Algorithms Relative to Fertilizer to Grain Ratio (FGR)
Nitrogen Saved Using the Canopy Sensors And Derived Algorithms Relative to Fertilizer to Grain Ratio (FGR)
Active light source crop sensors Chlorophyll meter
Summary of In-Field Plant Sensingfor Nitrogen Management • A significant relationship between canopy sensor sufficiency index and optimal N rate was observed in about half of the field studies. • Combined across all sites meaningful algorithms were created to give assurance that these sensors could be used for variable-rate N applications. • Algorithms should be adjusted as fertilizer and grain prices vary. • The primary advantages of sensor-based measurements is improved accuracy to site-specific crop need.
Fields and Situations Most Suitedfor Sensor-Based Variable Rate Nitrogen Applications • Fields with extreme variability in soil type • Fields experiencing a wet spring or early summer (loss of applied N) and where additional N fertilizer is needed (i.e., rescue N) • Fields that have received recent manure applications • Fields receiving uneven N fertilization because of application equipment failure • Fields coming out of pasture, hay, or CRP management • Fields of corn-after-corn, particularly when the field has previously been cropped in a different rotation • Fields following a droughty growing season
An Example of a N Rate Recommendation Algorithm Shown Relative to Canopy Sensor-Based Sufficiency Index (SI).