Download
1 / 10
100 likes | 314 Vues
Northwest Sardine Survey (NWSS) Aerial Sardine Survey Plan for 2011 Northwest Sardine Survey, LLC (Jerry Thon, Principal) Science Advisor: Tom Jagielo . Background. Pilot Study in 2008 - Northwest Funded by NWSS Method Approved by STAR Panel for use in PFMC Stock Assessments

E N D
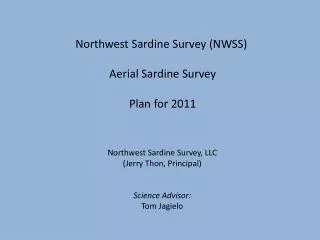
Northwest Sardine Survey (NWSS)Aerial Sardine SurveyPlan for 2011 Northwest Sardine Survey, LLC (Jerry Thon, Principal)Science Advisor:Tom Jagielo
Background • Pilot Study in 2008 - Northwest Funded by NWSS Method Approved by STAR Panel for use in PFMC Stock Assessments • Aerial Survey in 2009 - Coastwide Funded by proceeds from EFP: NWSS and CWPA • Aerial Survey in 2010 - Coastwide Funded by proceeds from EFP: NWSS and CWPA • Plan for 2011 - Coverage off WA and OR To be funded by proceeds from EFP: NWSS
2011 Aerial Survey Objectives • Conduct an aerial survey of Pacific sardine to obtain a third biomass data point using this method – Survey area off WA and OR. • Conduct point sets over a broad area (these are used to relate the aerial survey to biomass). • New stratification to help reduce the CV of the biomass estimate from the aerial survey.
2011 Aerial Survey Design • Stage 1 Sampling: Aerial Survey Transects 41 Transects off Washington and Oregon Transects oriented E/W - Two strata: 7.5 nm and 15 nm spacing • Stage 2 Sampling: At-Sea Point Sets 76 Sampled Schools Distributed by Size: Size bins range from 100 m2 to 10,000 m2 (4-82 mt) • Biomass and CV are estimated from the transect and point set data
Aerial Survey Coverage Southern Area -- Tillamook, OR to CA Border -- 11 Transects – 15 nm apart Cape Flattery to OR/CA Border – 41 Transects Northern Area -- Cape Flattery to Tillamook, OR -- 30 Transects -- 7.5 nm apart
2011 Aerial Survey Logistics • 4 EFP Permitted Purse Seine Vessels • Three Survey Aircraft • Aircraft are equipped with FMC Digital Aerial Photography Data Acquisition System
Biological Sampling • Point Sets are sampled for: • Length • Weight • Maturity • Age (otoliths) • N = 50 fish, taken from unsorted catch at beginning, middle, and end of delivery as it is pumped
Some Exceedingly Large Schools Have Been ObservedTransect No. 6 8-22-2009 Photo 258 School Area = 504909.7 m² School Biomass = 3911.3 mt