Download

1 / 29
290 likes | 396 Vues
Data assimilation and Forecast activities in support of NAME. The NAME Team at CPC: Kingtse Mo, Wayne Higgins, Jae Schemm, Muthuvel Chelliah, Wesley Ebisuzaki, Marco Carrera, Wei Shi, Hyun Kyung Kim, Yucheng Song and Evgeney Yarosh. Best use the NAME data.

E N D
Data assimilation and Forecast activities in support of NAME The NAME Team at CPC: Kingtse Mo, Wayne Higgins, Jae Schemm, Muthuvel Chelliah, Wesley Ebisuzaki, Marco Carrera, Wei Shi, Hyun Kyung Kim, Yucheng Song and Evgeney Yarosh
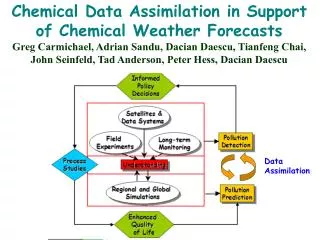
Best use the NAME data • Understand the dynamical processes related to NAME • Improve warm season precipitation forecasts • Approach • Monitoring • Data assimilation & RR • Modeling issues: resolution, physical processes : convection in a complex terrain, Better usage of satellite observations Prediction: A test bed for hydromet
Monitoring effort in support of NAME04 • Archive GFS (T126, 1 degree) and the operational EDAS (40-km and 12 km) for monitoring • Set up web monitoring pages in support of the NAME 04 • Set up rotation of the monitoring director in support of the CPC/HPC briefing
Regional Reanalysis • Produced by the EMC and post processed and archived at the CPC • Archive selected daily and 3-hourly variables and all monthly mean quantities at each synoptic time. • Form Climatology of the above fields (1979-2001) DATA Distribution • Climatology to UCAR/JOSS • Total archive will be distributed by ftp • –
Regional Reanalysis(Mesinger et. al. 2004) • Model: Eta 32km, 45 vertical levels • Period: 1 Jan 1979 – 31 Dec 2002 • Domain: North America and adjacent oceans • Precipitation assimilation: • U.S.: PRISM corrected gauge analysis; • Mexico: Rain gauge analysis; • other areas: CMAP pentad analysis (1979-2002) • CMORPH hourly (2003 on ward)
Precipitation and Surface Temperature • Precipitation and Surface Temperature from the RR compare favorably with observations. • Surface Temperature is not assimilated. • The seasonal cycle of Precipitation is well captured by the RR • Relationships between E and P in the RR are consistent with those reported by Rasmusson (1968,1969), Rasmusson and Berbery (1996)
Annual Cycle of Precipitation (mm day-1) (warm season) • May:Heaviest P in the western Gulf Coast and lower Mississippi Valley. • June: P reaches a maximum over the Central US, while monsoon rainfall spreads northward along the western slopes of the SMO. • July: Monsoon P shifts northward into AZ/NM by early July while P decreases in Central US. • August: Monsoon P reaches a maximum over SW and then starts to retreat. The demise of the monsoon is more gradual than the onset. (Higgins et al. 1998)
Precipitation Difference (mm day-1) (RR – Obs) RR assimilates observed P, so the differences between RR and obs are expected to be small. Largest differences are over southern Mexico , the difference is about 8% of the total rainfall
Annual Cycle of T2m Temperature (°C) (warm season)
Surface Temperature Difference (°C) (RR-OBS)
Seasonal cycle of Moisture Budget Parameters (32N-36N) • E> P over the central US in summer • D(Q) contribution over the central US is small • Both E and D(Q) contribute to rainfall over the Southwest (E-P) P -DQ E Rasmusson 1968,1969
Diurnal Cycle P for August (1979-2001) The RR captures the eastward propagation of the diurnal Max
Low Level Jets • The LLJ from the Caribbean (CALLJ) is well captured by the RR. • The Great Plains LLJ (GPLLJ) in the RR is similar to that in the operational EDAS and compares well to wind profiler data. • The Gulf of California LLJ (GCLLJ) may be too strong compared to observations
CALLJ 925-hPa Zonal Wind (m s-1) August May September June July October
Meridional Wind (m s-1) at (36N,97.5W) (GPLLJ) RR Wind Profiler Strong diurnal cycle MAX :950-975 hPa Higgins et al. (1997)
Vertically Integrated Meridional Moisture Flux (kg/ms) (1995-2000) RR RR - OpEDAS RR [qv] Over the Guf of California are stronger than EDAS Differences can be as large as 60kg/(ms) GCLLJ
RR and pilot balloon and soundingsat Puerto Penasco RR obs 252-m obs wind (Douglas et al. 1998) Profile of v-wind RR vwind captures the diurnal cycle but it is 3m/s higher than obs, 1 LT 1LT 16 LT 16LT
Vertical cross section of qv at 30N 1998-2000 RR Operational EDAS
Challenges • The NAME data will give guidance to • the location, strength and variation of the GCLLJ. • Relationship between the GCLLJ, rainfall and the GPLLJ • We need to understand • The reasons that the RR GCLLJ is stronger than the operational EDAS
Data impact studiesBoth GFS and EDAS • We will assimilate all data getting to the GTS within the cut off time • Carefully monitoring data inputs, perform diagnostics, and comparison with obs. • Perform data impact studies using both the global and regional data assimilation systems when all data are collected and obtained from JOSS • Special data impact studies will be made.
Global modeling issues • Model resolution • Physical processes: Convection in complex terrain, • Predictability Think globally, act locally
Experiments • Models: with observed SSTs • A) T126L28 GFS Model (approx 80 km) • B) T62 GFS model (approx 200 km) • C) T62 with RSM80 downscaling Conclusions • T126 Fcst performs better than T62 over the United States and Mexico • T62 does not recognize the Gulf of California and can not capture anomalies associated with monsoon rainfall The RSM/T62 does not improve Fcsts because the RSM is not Able to correct errors of the T62 model.
RSM/T62 ensemble mean P P from RSM/T62 is similar to the T62 Fcsts The RSM can not correct errors in the T62 Fcst to improve P
Physical Processes • Physical Processes : Diurnal cycle Precipitation and related circulation anomalies in a complex terrain; (Siegfried Schubert) • NAMAP 1 (Dave Gutzler) • CPT team and NAMAP 2 (Dave Gutzler) • Seasonal Forecast Experiments : Establish of the Baseline of prediction skill (Jae Schemm) • Improve fcsts in operational centers
III. Prediction Linkages between climate and weather :A Hydromet Test bed (Precip QPF fcsts) • improve the precip prediction over the NAME region associated with the leading patterns of climate variability; • determine the impact of boundary conditions :Coupled model vs two tier prediction system. • assess the impact of boundary conditions like vegetation fraction, soil conditions and soil moisture on precip prediction in the seasonal time scales • Better use of satellite data • Enhance local climate prediction using regional models
Milestones • Benchmark and assessment of global and regional model performance (2004) (NAMAP1,NAMAP2, Fcst Exp) • Evaluate impact of the data from the NAME campaign on operational data assimilation and forecasts (2005) • Simulate the monsoon onset to within a week of accuracy (2006) • Simulate diurnal cycle of observed precip to within 20% of a monthly means (2007)