Download
1 / 14
170 likes | 403 Vues
Waveguide excitation fluorescence microscopy: A new tool for sensing and imaging the biointerface. H. M. Grandin, B. Stadler, M. Textor, J. Voros Biointerface Group, Lab. For Surface Science and Tech., Dept. of Materials, ETH-Z. Presented by: Ayca Yalcin. Outline. Introduction to WExFM

E N D
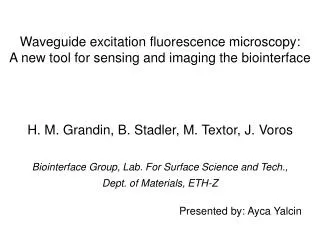
Waveguide excitation fluorescence microscopy: A new tool for sensing and imaging the biointerface H. M. Grandin, B. Stadler, M. Textor, J. Voros Biointerface Group, Lab. For Surface Science and Tech., Dept. of Materials, ETH-Z Presented by: Ayca Yalcin
Outline • Introduction to WExFM • OWLS, TIRFM, Zeptoreader • WExFM setup • Surface Patterning • Bio results • Discussion on system performance • Conclusion
Introduction to WExFM • Makes use of an optical grating to incouple laser light into a waveguide. • Incident laser beam is diffracted from the grating and propagates via internal reflections inside the waveguide. • Multiple reflections within the waveguide generate an evanescent field of intensity I(z), z being the distance perpendicular to the surface. Neff=nsin+l/
Optical Waveguide Lightmode Spectroscopy • In situ measurement of the surface immobilization of biomolecules in aqueous environment. • OWLS is based on incoupling of a laser into a waveguide by an optical grating. • The incoupling angles are sensitive to refractive index changes within the evanescent field generated above the surface. • The angles are monitored by continuously changing the incident angle of the laser and measuring the incoupled light intensity with a photodetector. • From refractive index changes, the adsorbed mass can be calculated using de Feijter‘s formula. (dn/dc=0.18cm3/g), (~2ng/cm2 sensitivity)
Total Internal Reflection Fluorescence Microscopy • Total internal reflection obtained by laser illumination from the periphery of the back focal plane of an objective lens. • Evanescent wave enters the medium of lower refractive index to ~0.1μm and excites fluorophores in this thin interfacial slice leading to high SNR. • TIRFM is often used for imaging focal adhesions of cells or monitoring in-situ adsorption-desorption kinetics of fluorescently labeled proteins. • Single molecule detection possible, >1ng/cm2 sensitivity.
Zeptoreader • ZeptoREADERTM (Zeptosens AG, Switzerland) uses the evanescent wave from a light beam coupled into OWLS-like waveguides to excite fluorophores. • The emitted light is imaged in a CCD-camera to gain additional information about the lateral distribution, although with poor lateral resolution. • Therefore it is impossible to investigate cell adhesion or small patterns with this set-up. • 13um resolution, pM sensitivity (zeptomoles)
Molecular-Assembly Patterning by Lift-Off 1. Pattern photoresist 2. Dip 30min in solution of poly(l-lysine)-graft-poly(ethylene glycol)/PEG-Biotin 3. Lift-off photoresist in organic solvent 4. Backfill with PLL-g-PEG Cell attachment to peptide modified PLL-g-PEG Biotin surface densities: a)26.6, b)13.3, c)5.3, d)2.7, e)0 pmol/cm2
Results • A linear slope is observed at these low concentrations, indicating a diffusion limited adsorption process. • Similar experiments indicated that 1ng/ml (<20pM) could easily be detected under these conditions. Mass adsorption curve obtained by OWLS (the symbols), fluorescence intensity obtained with WExFM (the solid line) after injection of 2ug/ml streptavidin-488. Fluorescence intensity vs. time. As the concentration increases from 2ng/ml(diamonds) to 20ng/ml(triangles) a 10-fold increase in the slope is observed, as determined by a linear fit. The flow rate was 0.2ml/min.
Epi-fluorescence (a) compared with WExFM images obtained with (b) and (c) without the use of an emission filter, for a 2ug/ml streptavidin-633 solution in contact with the waveguide. The signal to noise of a:b:c is 1:13:7. 'Focal Adhesions’(:specific types of large macromolecular assemblies) serve as a biochemical signalling hub to concentrate and direct numerous signaling proteins at sites of integrin binding and clustering. A comparison of (a) Epi-fluorescence to (b) WExFM imaging of a fibroblast cell fixed and stained (Alexa Fluor 488) for vinculin, a protein associated with focal adhesions.
Discussion • Lines in the images due to inhomogeneities in or on the grating. • If the defect is on the grating this results in less efficient incoupling of the incident light. If the defect is at some distance from the grating it will outcouple the light and cause a complex interference/diffraction pattern (Paulus and Martin, 2003). • By changing the position of the laser along the grating changes in line patterns could be observed. However, not possible to remove the lines entirely through a weighted sum of the images obtained in this way. • - Imperative to good WExFM images is a clean and defect free grating and waveguide surface.
Comparison with other techniques • The WExFM combines OWLS with the substrate and objective flexibility of an Epi-FM and with the strong signal and high surface sensitivity of TIRFM. • WExFM vs OWLS: • fluorescence sensitivity along the waveguide vs. mass sensitivity only on grating area • laser angle scanned vs. sample rotated • WExFM: higher sensitivity • WExFM vs. Zeptoreader: • Comparable sensitivity • WExFM: able to monitor dynamic bio-interactions more closely • WExFM vs. TIRFM: • Comparable sensitivity • WExFM: compatible with any magnification • WExFM: light incoupling away from sensing area
Conclusion • WExFM has potential for dynamic and quantitative investigation of bio-interfacial events in situ. • TIRFM-like surface sensitivity with the additional advantage of flexibility in objectives used, flow cell compatibility and potential for quantification of the fluorescence signal. • High target sensitivity for fluorescence detection, high surface specificity, large area analysis with sub-um resolution, ‘built-in’ calibration of fluorescent light gain, and capability to perform multi-color imaging in situ and in real time. • Sensitivity of the system demonstrated through dynamic measurements of the streptavidin–biotin binding event. • SNR compared to conventional FM gives >10-fold improvement. • Surface specificity illustrated in a comparison of fibroblast focal adhesion images.
References • J. Voros, “The Density and Refractive Index of Adsorbing Protein Layers,” Biophysical Journal Volume 87 July 2004 553-561. • L. J. Bonderer, “Waveguide Excitation Fluorescence Microscopy and its ability to investigate cell-surface interactions,” Diploma Thesis, ETH, Zurich, March 2005. • D. Falconnet et al., “A combined Photolithographic and Molecular-Assembly Approach to produce functional micropatterns for applications in the biosciences,” Advanced Functional Materials, 2004, 14, No.8.