ADDITIONAL NOTE ON THE SCATTER PLOT PROJECT -
In this project, you will submit your calculations for slope and y-intercept on a separate sheet. Learn how to use a graphing calculator to determine the line of best fit through the Linear Regression feature. Follow the instructions for entering data and calculating the equation efficiently. Additionally, practice solving inequalities by graphing the given solutions on a number line. Complete the assigned homework review for deeper understanding and clarity in solving inequalities.

ADDITIONAL NOTE ON THE SCATTER PLOT PROJECT -
E N D
Presentation Transcript
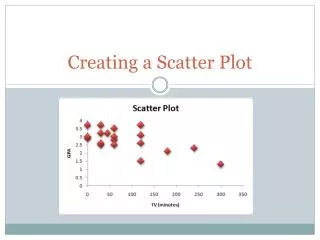
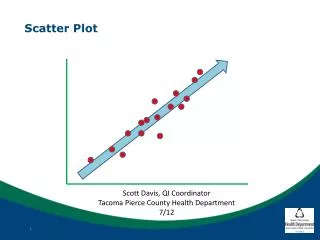
ADDITIONAL NOTE ON THE SCATTER PLOT PROJECT - Turn in your calculation of slope and the y-intercept on a separate sheet of paper. Today we'll learn how to use a graphing calculator to calculate the equation for the line of best fit.
To let the Calculator create the Linear equation: STAT - CALC - 4 (LinReg) type L1,L3, VARS-YVARS-Funct-Y2 ENTER
On the graphing calculator: STAT - Edit - enter values here. Call Price L1, Student L2, TOTAL L3 Then hit ZOOM:9 (zoomstat)
-5 5 -4 -3 -2 -1 1 2 0 3 4 10 8 9 -10 -9 -8 -7 -6 -5 -4 -3 -2 -1 0 1 2 3 4 5 6 7 12/9 HOMEWORK Solving Inequalities - Review: ON A SHEET OF PAPER. Graph each solution set below on a number line. 1. x < -3 2. x ≤ 2 3. x < 9 4. x ≥ 5 5. x < -1 6. x > 4