
Uploaded by
buzz
6 SLIDES
195 VUES
60LIKES
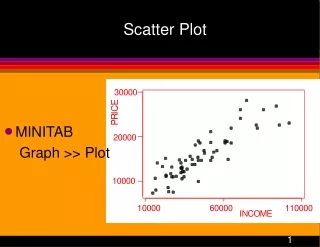
Scatter Plot Analysis and Averages for Q1-Q13: Exam 2 Revision Guide
DESCRIPTION
This comprehensive revision guide focuses on scatter plot analyses and averages for questions Q1 through Q13 of Exam 2. It provides visual representations of data relationships, aiding in the understanding of trends and correlations. By systematically reviewing each question and its respective scatter plots, students can effectively prepare for their upcoming exams. The guide emphasizes practical application and interpretation of statistical data, ensuring clarity in concepts related to averages and scatter plots.
Download

1 / 6
Télécharger la présentation 
Scatter Plot Analysis and Averages for Q1-Q13: Exam 2 Revision Guide
An Image/Link below is provided (as is) to download presentation
Download Policy: Content on the Website is provided to you AS IS for your information and personal use and may not be sold / licensed / shared on other websites without getting consent from its author.
Content is provided to you AS IS for your information and personal use only.
Download presentation by click this link.
While downloading, if for some reason you are not able to download a presentation, the publisher may have deleted the file from their server.
During download, if you can't get a presentation, the file might be deleted by the publisher.
E N D


More Related