Scatter Plots and Line Relationships in Minitab\
Learn about scatter plots, least square lines, covariance, correlation coefficients, and more in Minitab. Understand how to interpret data relationships and compute statistical measures accurately.

Scatter Plots and Line Relationships in Minitab\
E N D
Presentation Transcript
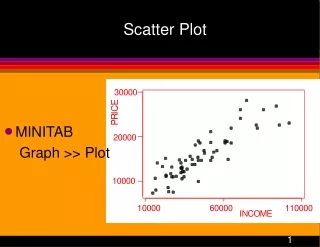
Scatter Plot • MINITAB Graph >> Plot
Linear Relationship and Error y y = b0 + b1 x yi x xi
Least Square (LS) Line • Line: • Error: • Sum of Squares of Error: • LS intercept and slope are obtained by minimizing SS Error with respect to b0 and b1
Facts About the LS Line • LS slope: Slopeb1 and correlation rhave the same sign • LS intercept:
More Facts About the LS • LS line passes through the averages • The average of LS fits is • The average of LS residuals is
Example of LS Line • MINITAB Stat >> Regression >> Fitted line plot
Another Example of LS Line • MINITAB Stat >> Regression >> Fitted line plot
Positive Association • Lines of averages INCOME
Negative Association • Lines of averages RENT PER SQFT FOOTAGE
Covariance, Cov(x,y) • Expected value of the cross-productterms of deviations from the means: sx,y= E [(x - mx)(y - my)] • Sample covariance
Some Remarks about Covariance • Cov(x,y) = Cov(y,x) • Covis a measure of linear relationship between x and y • No linear relationship, Cov(x,y) = 0 • Positive slope, Cov(x,y) > 0 • Negative slope, Cov(x,y) < 0 • Covdepends on the units of measurement of the two variables • Cov(x,x) = Var(x)
Correlation Coefficient, Corr(x,y) • Correlation coefficient • Sample correlation coefficient • An average of the cross-product of the standardize values of the two variables
Example of Positive Association Cov(x,y) = 92073109 Corr(x,y) = 0.875 INCOME
Example of Negative Association RENT PER SQFT Cov(x,y) = -16.242 Corr(x,y) = -0.456 FOOTAGE
Bivariate Data • Pair of variables: x =Explanatory, predictor, or independent variable • income of an individual y =Response variable or dependent variable • price of an item purchased by the individual • Data: (x1,y1), (x2,y2), . . . , (xn,yn) individual 1 individual 2 individual n
Perfect Positive Correlation r = 1 y = 5 + 3x
Perfect Negative Correlation r = -1 y = 5 - 2x
Perfect Linear Relationships, r2 = 1 Corr = - 1 Corr = 1
A Measure of Fit of the Line to Data • 0 < R2< 1 • R2 = 1 implies the perfect fit of data to LS line • R2 = 0 indicates no fit • Percent of variation of yiexplained by xi
Perfect Relationship, But Zero Correlation Corr = 0 y = (x - 3)2
Remarks about Correlation Coef. • Corr(x,y) is a unit free index of linear relationship between the two variables • Corr(x,y) = Corr(y,x) • Corrdoes not change when: • any of the two variables is multiplied by a positiveconstant • both variables are multiplied by negative constants • a constant is added to each variable • The sign of Corrchanges if oneof the variables is multiplied by a negative constant
Computation in MINITAB • Stat >> Basic Statistics >> Covariance INCOME PRICE INCOME 435696626 PRICE 92073109 25405637 Variances Covariance • Stat >> Basic Statistics >> Correlation Correlations (Pearson) Correlation of INCOME and PRICE = 0.875