DCM Advanced, Part II
250 likes | 856 Vues
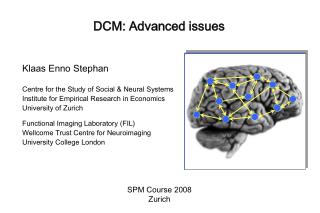
DCM Advanced, Part II. Will Penny (Klaas Stephan) Wellcome Trust Centre for Neuroimaging Institute of Neurology University College London. SPM Course 2014 @ FIL. Overview. Extended DCM for fMRI: nonlinear, two-state, stochastic Embedding computational models in DCMs

DCM Advanced, Part II
E N D
Presentation Transcript
DCM Advanced, Part II Will Penny (Klaas Stephan) WellcomeTrust Centre for Neuroimaging Institute ofNeurology University College London SPM Course 2014 @ FIL
Overview • Extended DCM for fMRI: nonlinear, two-state, stochastic • Embedding computational models in DCMs • Clinical Applications
Neural state equation endogenous connectivity modulation of connectivity direct inputs modulatory input u2(t) driving input u1(t) t t y BOLD y y y λ hemodynamic model activity x2(t) activity x3(t) activity x1(t) x neuronal states integration The classical DCM: a deterministic, one-state, bilinear model
Factorial structure of model specification in DCM • Three dimensions of model specification: • bilinear vs. nonlinear • single-state vs. two-state (per region) • deterministic vs. stochastic • Specification via GUI.
non-linear DCM modulation driving input bilinear DCM driving input modulation Two-dimensional Taylor series (around x0=0, u0=0): Nonlinear state equation: Bilinear state equation:
Neural population activity x3 fMRI signal change (%) x1 x2 u2 u1 Nonlinear dynamic causal model (DCM) Stephan et al. 2008, NeuroImage
attention MAP = 1.25 0.10 PPC 0.26 0.39 1.25 0.26 V1 stim 0.13 V5 0.46 0.50 motion Stephan et al. 2008, NeuroImage
Two-state DCM Single-state DCM Two-state DCM input Extrinsic (between-region) coupling Intrinsic (within-region) coupling Marreiros et al. 2008, NeuroImage
Estimates of hidden causes and states (Generalised filtering) Stochastic DCM • random state fluctuations w(x)account for endogenous fluctuations, • fluctuations w(v) induce uncertainty about how inputs influence neuronal activity • can be fitted to resting state data Li et al. 2011, NeuroImage
Estimates of hidden causes and states (Generalised filtering) Stochastic DCM • Good working knowledge of dDCM • sDCMs (esp. for nonlinear models) can have richer dynamics than dDCM • Model selection may be easier than with dDCM • See Daunizeau et al. ‘sDCM: Should we care about neuronal noise ?’, Neuroimage, 2012
Overview • Extended DCM for fMRI: nonlinear, two-state, stochastic • Embedding computational models in DCMs • Clinical Applications
Conditioning Stimulus Target Stimulus or 1 0.8 or 0.6 CS TS Response 0.4 0 200 400 600 800 2000 ± 650 CS 1 Time (ms) CS 0.2 2 0 0 200 400 600 800 1000 Learning ofdynamic audio-visualassociations p(face) trial den Ouden et al. 2010, J. Neurosci.
k vt-1 vt rt rt+1 ut ut+1 Hierarchical Bayesian learning model prior on volatility volatility probabilistic association observed events Behrens et al. 2007, Nat. Neurosci.
1 True Bayes Vol HMM fixed 0.8 HMM learn RW 0.6 p(F) 450 0.4 440 0.2 430 RT (ms) 420 0 400 440 480 520 560 600 Trial 410 400 390 0.1 0.3 0.5 0.7 0.9 p(outcome) Explaining RTs by different learning models Reaction times Bayesian model selection: hierarchical Bayesianmodel performsbest • 5 alternative learning models: • categorical probabilities • hierarchical Bayesian learner • Rescorla-Wagner • Hidden Markov models (2 variants) den Ouden et al. 2010, J. Neurosci.
p < 0.05 (SVC) 0 0 -0.5 -0.5 BOLD resp. (a.u.) BOLD resp. (a.u.) -1 -1 -1.5 -1.5 -2 -2 p(F) p(H) p(F) p(H) Stimulus-independent prediction error Putamen Premotor cortex p < 0.05 (cluster-level whole- brain corrected) den Ouden et al. 2010, J. Neurosci.
Prediction error (PE) activity in the putamen PE duringactive sensorylearning PE duringincidental sensorylearning den Ouden et al. 2009, Cerebral Cortex p < 0.05 (SVC) PE during reinforcement learning PE = “teaching signal” for synaptic plasticity during learning O'Doherty et al. 2004, Science Could the putamen be regulating trial-by-trial changes of task-relevant connections?
Prediction errors control plasticity during adaptive cognition Hierarchical Bayesian learning model • Modulation of visuo-motor connections by striatalprediction error activity • Influence of visual areas on premotor cortex: • stronger for surprising stimuli • weaker for expected stimuli PUT p= 0.017 p= 0.010 PMd PPA FFA den Ouden et al. 2010, J. Neurosci.
Overview • Extended DCM for fMRI: nonlinear, two-state, stochastic • Embedding computational models in DCMs • Clinical Applications
Model-based predictions for single patients model structure BMS set of parameter estimates model-based decoding
BMS: Parkison‘s disease and treatment Age-matched controls PD patients on medication PD patients off medication Selection of action modulates connections between PFC and SMA DA-dependent functional disconnection of the SMA Rowe et al. 2010, NeuroImage
Model-based decoding by generative embedding A A step 1 — model inversion step 2 — kernel construction A → B A → C B → B B → C B B C C measurements from an individual subject subject-specificinverted generative model subject representation in the generative score space step 3 — support vector classification step 4 — interpretation jointly discriminative model parameters separating hyperplane fitted to discriminate between groups Brodersen et al. 2011, PLoS Comput. Biol.
Model-based decoding of disease status: mildly aphasic patients (N=11) vs. controls (N=26) Connectional fingerprints from a 6-region DCM of auditory areas during speech perception Brodersen et al. 2011, PLoS Comput. Biol.
Model-based decoding of disease status: aphasic patients (N=11) vs. controls (N=26) Classification accuracy PT PT HG(A1) HG(A1) MGB MGB auditory stimuli Brodersen et al. 2011, PLoS Comput. Biol.
Generative embedding using DCM Multivariate searchlight classification analysis
Summary • Model Selection • Extended DCM for fMRI: nonlinear, two-state, stochastic • Embedding computational models in DCMs • Clinical Applications