Download
1 / 28
280 likes | 582 Vues
Revising the Air Quality Index and Setting a Significant Harm Level for PM 2.5. Overview. What we’ll cover: Possible revisions to AQI sub-index for PM 2.5 – lower end of the range Possible Significant Harm Level (SHL) for PM 2.5 – upper end of the range

E N D
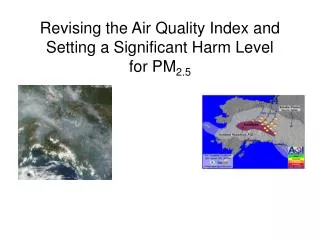
Revising the Air Quality Index and Setting a Significant Harm Level for PM2.5
Overview • What we’ll cover: • Possible revisions to AQI sub-index for PM2.5 – lower end of the range • Possible Significant Harm Level (SHL) for PM2.5 – upper end of the range • Analysis of Air Quality Data showing impacts • Key questions • Next steps
Why Are We Doing This? • To reflect change to PM2.5 daily standard • 24-hr PM2.5 NAAQS was set in 1997 to provide protection against “hotspots” or risks from seasonal emissions • 24-hr PM2.5 NAAQS (35 µg/m3) set in October 2006 to protect against health effects of short-term exposures • States are asking for AQI to be updated • Many agencies have already changed the level at which they call air quality action days
Typical Lower End of the AQI Range Annual Standard Short-term Standard General Population Benchmark
Current AQI Sub-Index for PM2.5 Is Different • Daily standard provided protection against risks from “hot spots” or seasonal emissions of PM2.5 • Annual standard provided bulk health protection against effects of short-term exposures Annual Standard (15 µg/m3) Midpoint Range (40 µg/m3) Daily Standard (65 µg/m3)
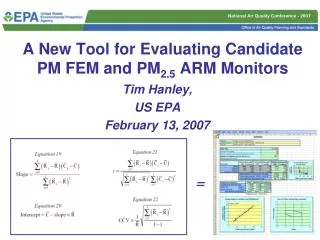
Possible Revisions to Lower End of Range • Set an AQI value of 100 equal to the level of the 24-hr PM2.5 NAAQS (35 µg/m3) – appropriate benchmark • Reduce an AQI value of 150 (now 65 µg/m3) to 55 µg/m3, which is in proportion to reduction in AQI value of 100 (from 40 to 35 µg/m3) • Based on the more extensive and stronger body of evidence linking 24-hr PM2.5 levels to serious morbidity and mortality effects • Leave AQI value of 50 at level of annual NAAQS (15 µg/m3)
Upper End of AQI Range Emergency Episode Plans Alert Level Warning Level Emergency Level Significant Harm Level (SHL)
SHL and Emergency Episode Plans Subpart H - Prevention of Air Pollution Emergency Episodes • SHL is a level that represents imminent and substantial endangerment (§51.151 CFR) • Currently there are SHLs for CO, NO2, O3, PM10 and SO2 • States must have contingency plans in place to avoid ever reaching the SHL • Need for plan is based on past air quality levels and priority level definitions (§51.150 CFR) • States should periodically reevaluate priority classification of all regions or portions of regions with in their borders (§51.153 CFR) • Plans must include actions at levels below the SHL (§51.152 CFR) • These plans often include 3 levels, the Alert, Warning and Emergency levels
Current Index Value of 500 for PM2.5 • The 500 level of the AQI for PM2.5 was set at 500 µg/m3 about the same level as British Smoke (which has a cut-point of approximately 4.5 microns) from 1950’s air pollution episodes • We indicated that if an SHL for PM2.5 is set at a different level we would adjust AQI accordingly • The SHL for PM10 is 600 µg/m3, also based on British Smoke levels • We did not have enough PM2.5 monitoring data to scale an index value of 500 to the PM10 SHL London buses are escorted by lantern at 10:30 in the morning. Donora, PA at noon on Oct. 29, 1948
Possible Revisions to Upper End of Range • Set the PM2.5 SHL at 350 µg/m3, 24-hr average • Scaling SHL to PM10, since on average about 60% of PM10 consists of PM2.5 • For intermediate breakpoints between an AQI value of 100 and SHL, set to reflect a generally linear relationship between increasing index values and increasing PM2.5 concentrations • Consistent with health evidence • Consistent with practice of setting breakpoints in symmetrical fashion where health information does not suggest particular levels • Easier for agencies to implement • Problem [good thing] is that this is based on episodes that happened a long time ago. It would be useful to have information about more recent episodes.
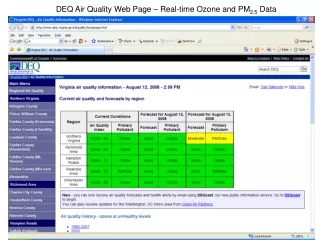
Possible Revisions to the AQI for PM2.5What the Monitoring Data Show
Air Quality Analyses • Site analysis showing increase in days per year if 100 level is dropped to 35 ug/m3 with additional map showing new sites affected • USA Today Cities • Comparison between current AQI and possible AQI • 35 ug/m3 vs. 40 ug/m3 • Differences in number of days per category • Comparison of categorical AQI distributions for each scenario • A count of the site days in the “Very Unhealthy” and “Hazardous” categories to determine any increases • Sites with concentrations > SHL compared to the current SHL and possible SHL
October 2003 – October 2006 Sites shown have at least 845 observations over three years
New Sites Affected by Setting the AQI 100 Level to 35.5 ug/m3 Sites shown have at least 845 observations over three years (October 2003-October 2006)
Average Number of Days Greater than Moderate for USA Today Cities (October 2003 – October 2006) Average Number of Days per Year Greater than Moderate for USA Today Cities (October 2003-October 2006) Days/Year >40 ug/m3 Days/Year >35 ug/m3
Average Number of Days Greater than Moderate for USA Today Cities (October 2003 – October 2006) Average Number of Days per Year Greater than Moderate for USA Today Cities (October 2003-October 2006) Days/Year >40 ug/m3 Days/Year >35 ug/m3
Differences in AQI Categories between Current and Possible AQI Possible AQI Current AQI October 2003-October 2006 Values reflect total number of days over three year period
Differences in AQI Categories between Current and Possible AQI Current AQI Possible AQI October 2003-October 2006 Values reflect total number of days over three year period
Differences in AQI Categories between Current and Possible AQI Current AQI Possible AQI October 2003-October 2006 Values reflect total number of days over three year period
Differences in AQI Categories between Current and Possible AQI Possible AQI Current AQI October 2003-October 2006 Values reflect total number of days over three year period
Number of Site-Days greater than an AQI value of 200 (October 2003-October 2006) Possible AQI
The Message • The greatest increase in days when comparing the current AQI to the new approach occurs in the “Unhealthy for Sensitive Groups” category followed by the “Unhealthy” category • There is little or no increase in the number of days for AQI categories above “Unhealthy” for most urban areas
Some Key Questions • Will lowering the PM2.5 sub-index breakpoints present unusual forecasting or communication problems? • Will more cities consider implementing a forecasting program? • For existing programs will forecasts need to be extended into additional seasons? • How to communicate the additional Code Orange or Red days? • How do agencies deal with very short-term (1-hr) high peaks of PM2.5 now? • Is more recent information available about public health impacts associated with high PM2.5 episodes? • Any others?
Next Steps for AQI and SHL Rulemaking • Seek stakeholder feedback • Publish proposed rule – late summer/fall 2007 • Publish final rule – winter 2008 • Issue guidance on 1-hr advisories that can be used in high PM2.5 episodes • Develop related outreach and educational materials to help communicate to the public that air quality is getting better, not worse
To send comments or ask questions: Susan Lyon Stone stone.susan@epa.gov 919-541-1146