Download
1 / 17
170 likes | 188 Vues
Hardware Ranch Irrigation. Using GIS to Improve Yield. Problem Statement. Hardware Ranch has a lot of Elk (several hundred last time we were there) The elk are fed during the winter Elk at Jackson Hole were fed about 400 lbs of hay per elk in 1997 Hay is grown on site for use as elk feed.

E N D
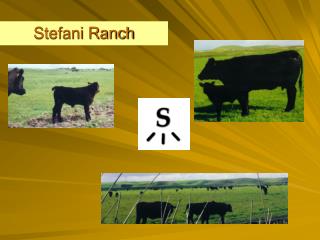
Hardware Ranch Irrigation Using GIS to Improve Yield
Problem Statement • Hardware Ranch has a lot of Elk (several hundred last time we were there) • The elk are fed during the winter • Elk at Jackson Hole were fed about 400 lbs of hay per elk in 1997 • Hay is grown on site for use as elk feed
But……. • Yield has been steadily declining for the past three years • This year, the yield was insufficient to feed the elk and hay was bought • Three main problems • High points in the meadow • Lack of irrigation planning • Ditch Conditions
GPS Survey • We wanted to gain experience with data collection • Borrowed USU GPS survey equipment • Recorded points along the ranch boundary, ditches, and irrigation culverts
Preparing the Data • Imported the survey points to GIS • WGS 1984 • Used the Editor Toolbar to create new shapefiles
Preparing the Data • 130 survey points • Meadow • Area: ~329,000 m2 (81.3 acres) • Perimeter: ~3080 m • Two main ditches • 1484 m • 214 m • 20 irrigation points
Preparing the Data • Decided to use TauDEM downslope influence function • Inputs • D∞ flow direction grid • Disturbance grid • Ouput • Downslope influence grid Tarboton, 2005
Preparing the Data • D∞ flow direction grid was obtained by obtaining a DEM and performing the Basic Grid Analysis
Preparing the Data • Steps in preparing the disturbance grid • Disturbance grid has values of one at disturbance location and zero elsewhere • Converting the irrigation point shapefile to a grid • Created a new field of all ones • Used 10-m grid cells to match DEM • Set the extents of the new grid to match the flow direction grid • Preparing the grid • Reclassified all grids with ‘no value’ to value = 0
Comparison of Methods • Wanted to compare the areas computed to have no water • Using point sources: 33% • Using line source: 17%
Improvements • For the first case: • Areas with no water decreased from 33% to 26% (5.7 acres) • For the second: • Areas with no water decreased from 17% to 9% (6.5 acres)
Recommendations • Consider adding more irrigation points • Consider using a ditch or pipe to provide water to large are with no water
Sources • http://www.bearriverinfo.org/ • Ownership information • http://agrc.its.state.ut.us/ • DEM • http://hydrology.neng.usu.edu/taudem/ • TauDEM information • http://www.hcn.org/servlets/hcn.Article?article_id=3648 • Jackson Hole elk information