Download
1 / 25
250 likes | 397 Vues
A dendroclimatic analysis of Chestnut oak in SW Virginia. Andria Dawson Bronwyn Gillanders Chika Sakata David Austin David Walker Sarah Appleton Shelly Griffin Valerie Trouet. Outline. Objectives Site selection & sampling methods Detrending & building chronology

E N D
A dendroclimatic analysis of Chestnut oak in SW Virginia Andria Dawson Bronwyn Gillanders Chika Sakata David Austin David Walker Sarah Appleton Shelly Griffin Valerie Trouet
Outline • Objectives • Site selection & sampling methods • Detrending & building chronology • Comparing climate data with chronology • Correlating regional chronologies • Summary & future research
Objectives • Create a chronology for Quercusprinus,chestnut oak. • Investigate climatic influences on chestnut growth chronology. • Determine relationships with other chronologies & develop a regional chronology.
Site Selection Dendroclimatic sampling strategy • High elevation, steep slope • Availability of older canopy trees • Little human influence Tree Selection • Large diameter • Flattened crown • Highly sinuous stem • No lower branches • Trees with little impact from other factors
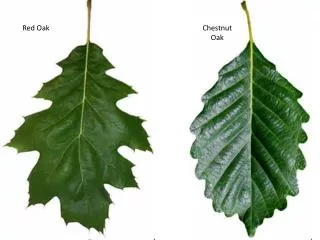
37 22.2’ N 80 14.8’ W Elevation: 1830 ft North facing slope • Upland oak pine forest • chestnut oak • scarlet oak • northern red oak • red maple • Virginia pine • pitch pine • eastern white pine
Methods Cored 36 chestnut oak Two cores / tree at 180
Cross-date Cores • Visually & statistically cross-dated cores with a combination of • Skeleton plots & list method • TSAP • COFECHA
Detrending Used smoothing spline with 50% cutoff
Earliest increment1759 • 53 series from 31 trees in chronology • 12 series were not included in the chronology • Interseries correlation: 0.563 • Mean sensitivity: 0.209
Final Chronology, Sample Depth & EPS Final chronology Sample depth Expressed population signal
Climate Analyses • Compare chronology with climatic parameters • Temperature • Precipitation • Palmer Drought Severity Index • Sea level pressure • Geopotential height • Oscillation indices (ENSO, NAO, SOI, AMO, AO, AMOC, PDA, etc) • Using weather station & gridded data • Blacksburg Weather Station data • 1891-2006 (temperature & precipitation); • 1869-2006 (PDSI)
p<0.05 p<0.05
Palmer Drought Severity Index - Season r = 0.3768
Precipitation Window midpoint r = 0.46
Post 1950 Temperature Temperature: September correlation Window midpoint r = -0.29 Pre 1950
Spectral & Wavelet Analyses 11 16.5 10.3 Chestnut Oak Chronology Precipitation • Both have strong 10-11 year period cycles in data • May precipitation may be a key driver
Regional Chronologies • 14 chronologies were correlated with our chronology • 3 white oak, 11 chestnut oak • 9 correlations were significant • 8 chronologies were used in a Principal Component Analysis (PCA) to look for a regional trend
Regional Chronology Comparison Charlottesville Brush Mountain Spur NADEF 2011 Lynn Hollow Craig Creek Watch Dog Mountain Otter Creek Blue Ridge Parkway
PCA results Component 2 • PCA 1 – 37.1% of variance • PCA 2 – 16.2% of variance Component 1
Correlations between PCA 1 and climate parameters p<0.05 p<0.05
SUMMARY • Built a chestnut oak chronology back to 1845 • Correlated our chronology with climate data & found that • Early summer PDSI & precipitation – positive • Sept temperature – negative • Strong regional correlation suggests that precipitation is a driver • Approximately 11 year periodicity in chronology & precipitation may be linked
Future Research • Strong signal in regional chronology suggests may be possible to reconstruct climate • Extend chronology through use of archaeological samples • Further investigation of PCA2
Acknowledgements • Jim Speer & Carolyn Copenheaver for organising fieldweek • Carolyn Copenheaver for providing chronologies • Peter Brown & Carolyn Copenheaver for financial support • Reece Brown for comedic relief