
SvPablo
E N D
Presentation Transcript
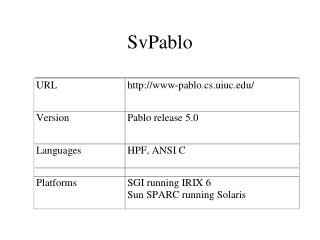
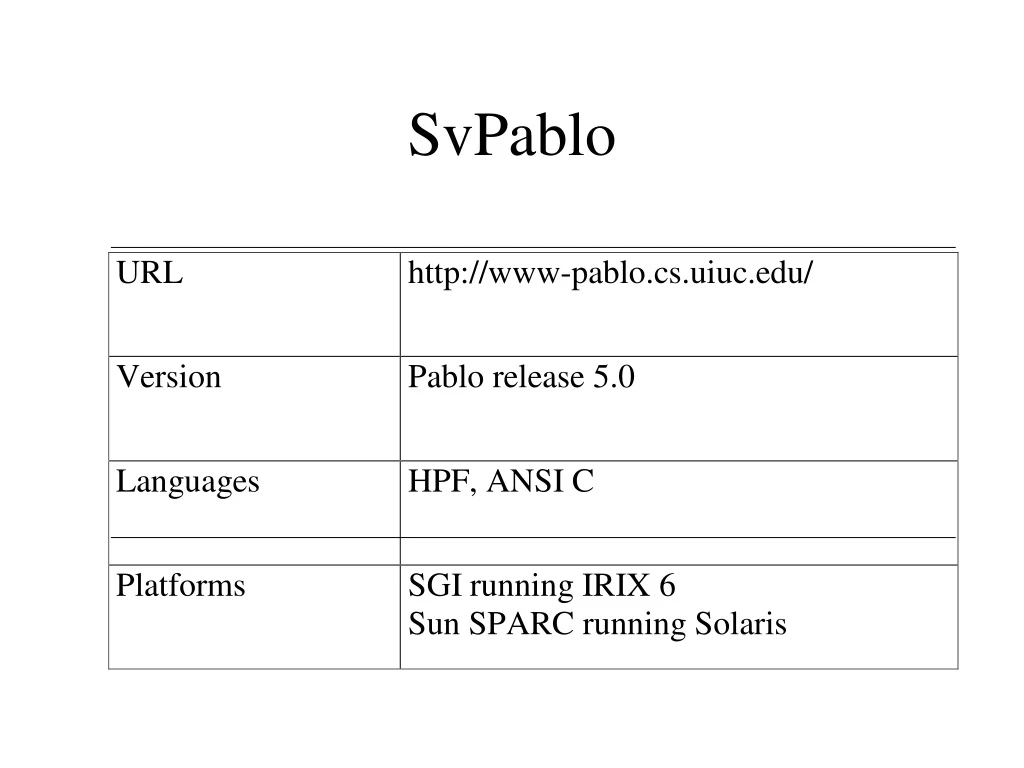
SvPablo • Source view Pablo • GUI for instrumenting source code and viewing runtime performance data • Joint work at Univ. of Illinois and Rice Univ. • HPF programs automatically instrumented by PGI HPF compiler • C programs interactively instrumented using GUI • Fortran 77/90 parser developed at JPL
SvPablo Project • Set of application source files • One or more performance contexts • Performance context includes • instrumentation specification - source code points where performance measurements are to be inserted • set of performance data files in SDDF, generated when instrumented code is run • Source files and parser options are shared among all contexts.
Project Menu Selections • New Project • Open Project • Edit Project • Select Project Base Directory • Load Color Configuration • Exit SvPablo
Instrumentation of HPF Programs • Given appropriate flags, the PGI HPF compiler automatically inserts calls to SvPablo instrumentation library routines at the beginning and end of every procedure and for each executable line. • After compiling and linking with the SvPablo HPF trace library, the user runs the instrumented executable which generates per-process trace files. • User runs HPFCombine to merge per-process trace files into a single performance file SDDF format.
Compiling and Linking Compile with pghpf flag -Mprof=lines to active calls to the SvPablo HPF trace library: % pghpf -c -Mprof=lines part1.F % pghpf -c -Mprof=lines part2.F Link with flag -Mprof=lines to activate calls to both theSvPablo HPF trace library and the PGI profiler library. Link with flag -Mprof=stats to activate only calls to the SvPablo HPF trace library: % pghpf -Mprof=stats part1.o part2.o /usr/local/SvPablo/lib/pghpf2SDDF.o
Procedure Metrics • Count • Exclusive Duration • Inclusive Duration • Send Msg Duration • Receive Msg Duration
Line Metrics • Count • Duration • Exclusive Duration • Message Send Duration • Message Send Count • Message Send Size • Message Receive Duration • Message Receive Count • Message Receive Size
Performance Statistics • Performance file contains the following statistics for the procedure and line performance metrics: • mean • standard deviation • minimum value • process corresponding to minimum value • maximum value • process corresponding to maximum value
Instrumentation of C Programs • Use GUI to instrument selected constructs in C source files • Compile instrumented source files and link with SvPablo C Trace Library • Run instrumented executable • Combine per-process trace files using CCombine
Files Created By Saving Instrumentation • Each instrumented file is saved as <file name>.<inst directory>.inst.c • The following files are saved in the instrumentation directory: • InstrumentationInit.c, containing the new main function for the instrumented program • projectHistory file, containing information for the parser and for CCombine • a configuration file named <file name>.c.config for each instrumented file, containing the instrumented points used by the GUI
Compiling and Linking % cc -64 -c file1.Context1.inst.c % cc -64 -c file2.Context1.inst.c % cc -64 -c Context1/InstrumentationInit.c % cc -64 -o app file1.Context1.inst.o file2.Context2.inst.o \ InstrumentationInit.o /usr/local/SvPablo/lib/cTrace.o \ /usr/local/SvPablo/lib/svPabloLib_MPI.o -L/usr/lib64/libmpi.so -lmpi