Costs
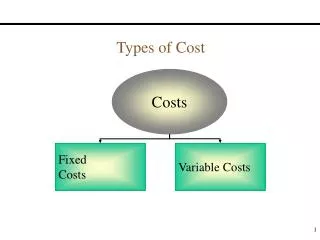
Costs. Perloff Chapter 7. Economic cost. business (accounting) costs : only explicit costs (out of pocket) economic costs : explicit cost + implicit cost = opportunity cost opportunity cost value of best alternative use of the resource

Costs
E N D
Presentation Transcript
Costs Perloff Chapter 7
Economic cost • business (accounting) costs: only explicit costs (out of pocket) • economic costs: explicit cost + implicit cost = opportunity cost • opportunity cost • value of best alternative use of the resource • classic example: "There's no such thing as a free lunch"
Short-run costs Source: Perloff
Cost, $ 400 Short-run cost curves C VC 27 A 1 216 20 1 B 120 48 F 0 2 4 6 8 10 Quantity, q , Units per day 60 MC AC a 28 27 AVC b 20 8 AFC 0 2 4 6 8 10 Quantity, q , Units per day Source: Perloff
Total product curve and VC Quantity, q , Total product of labor, Units per day Variable cost 13 10 6 5 1 0 5 20 24 46 77 25 100 120 230 385 L , Hours of labor per day VC = wL , Variable cost, $ Source: Perloff
The long-run: input choice Source: Perloff
Isocost Lines K , Units of capital per year $150 = 15 — — — $ 10 $100 e = 10 — — — $ 10 d c $50 = 5 — — — $10 b $ 50 isocost $100 isocost $150 isocost a $50 $100 $150 = = = — — — 10 — — — 20 — — — 30 $ 5 $ 5 $ 5 Source: Perloff , Units of labor per year
Cost minimisation Lowest isocost rule K , Units of q = 100 isoquant capital per year Tangency rule 3,000-kr isocost y 303 2,000-kr isocost 1,000-kr isocost x 100 z 28 0 24 50 116 L , Units of labor per year Source: Perloff
Three (equivalent) rules for cost minimisation 1. Lowest Isocost 2. Tangency 3. Last dollar rule (equimarginal returns)
Cobb-Douglas example K , Units of capital per year y 303 At X: x 100 z 28 0 24 50 116 L , Units of labor per year At Y: Source: Perloff
Factor price changes K , Units of q = 100 isoquant capital per year Original isocost, 2,000 kr New isocost, 1,032 kr x 100 v 52 0 50 77 L , Workers per year Source: Perloff
Expansion path K , Units of capital per year 4,000-kr isocost 3,000-kr isocost Expansion path 2,000-kr isocost z 200 y 150 x 100 200 isoquant 150 isoquant 100 isoquant 0 50 75 100 L , Workers per year Source: Perloff
Long run total cost curve Long-run cost curve C , Cost, kroner 4,000 Z 3,000 Y 2,000 X 0 100 150 200 q , Units per year Source: Perloff
Returns to scale and LAC K , Units of capital per year d 8 q = 8 c d : Decreasing returns to scale c 4 q = 6 b 2 b c : Constant returns to scale a 1 q = 3 q = 1 a b : Increasing returns to scale 0 1 2 4 8 L , Work hours per year Source: Perloff
Returns to scale and LAC (cont) Source: Perloff
Long and short run expansion K , Capital per year 4,616 kr Long-run expansion path 4,000 kr 2,000 kr z 200 y Short-run x expansion path 100 200 isoquant 100 isoquant 0 50 100 159 L , Workers per year Source: Perloff
Relationship between LAC and SAC Average cost, $ LRAC 3 SRAC 2 SRAC 1 3 SRAC SRAC b 12 d 10 a c e 0 q q q , Output per day 1 2 Source: Perloff
Learning by doing Average cost Improvements in productivity which result from knowledge and experience Economies of scale A B Learning by doing C b 1 AC 2 AC c 3 AC q q q 1 2 3 q , Output per period Source: Perloff