Download
1 / 18
180 likes | 400 Vues
INFRA RED ABSORPTION SPECTROSCOPY. Kateřina Hynštová. Principle of IR. In the context of infra red spectroscopy the term "infra red" covers the range of the electromagnetic spectrum between 0.78 and 1000 mm. Wavenumbers. wavelength is measured in "wavenumbers„ wavenumber = 1 / wavelength

E N D
INFRA RED ABSORPTION SPECTROSCOPY Kateřina Hynštová
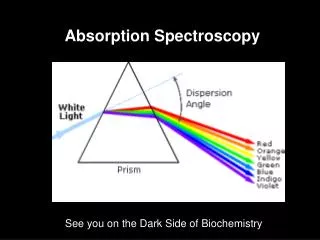
Principle of IR • In the context of infra red spectroscopy the term "infra red" covers the range of the electromagnetic spectrum between 0.78 and 1000 mm.
Wavenumbers • wavelength is measured in "wavenumbers„ • wavenumber = 1 / wavelength • in centimetersIt is useful to divide the infra red region into three sections; near, mid and far infra red;
Regions of wavelength range • Wavenumber range (cm-1) • Near0.78 - 2.51 2800 – 4000 • Middle2.5 – 504000- 200 • Far50 -1000200 - 10 • The most useful I.R. region lies between 4000 - 670cm-1.
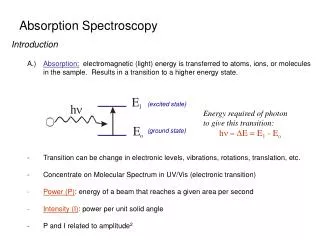
Theory of infra red absorption • IR radiation does not have enough energy to induce electronic transitions as seen with UV. • Absorption of IR is restricted to compounds with small energy differences in the possible vibrational and rotational states. • For a molecule to absorb IR, the vibrations or rotations within a molecule must cause a net change in the dipole moment of the molecule.
Molecular rotations • Rotational transitions are of little use to the spectroscopist. • Rotational levels are quantized, and absorption of IR by gases yields line spectra. • However, in liquids or solids, these lines broaden into a continuum due to molecular collisions and other interactions.
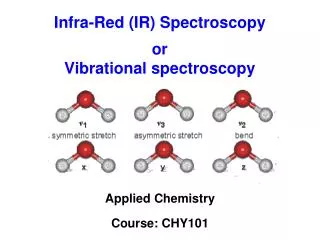
Molecular vibrations • The positions of atoms in a molecules are not fixed; they are subject to a number of different vibrations.
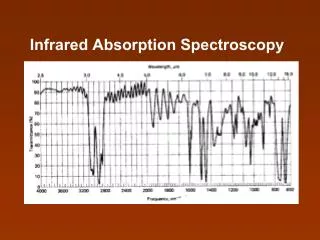
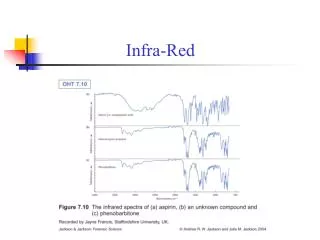
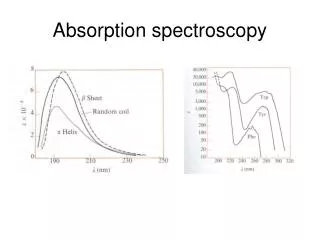
Spectra • The twodimensional plot • The dependece of transmitance on wavenumber • Each compound has its own specific spectra
Percentage transmittance • A percentage transmittance of 100 would mean that all of that frequency passed straight through the compound without any being absorbed. • In practice, that never happens - there is always some small loss, giving a transmittance of perhaps 95% as the best you can achieve. • A transmittance of only 5% would mean that nearly all of that particular frequency is absorbed by the compound. A very high absorption of this sort tells you important things about the bonds in the compound.
Methods • KBr • ATR • Transmission • RAIS
Reflection Adsorbtion Infrared Spectroscopy • Reflection Adsorption Infrared Spectroscopy (RAIRS) offers a means of probing vibrations at surfaces with high resolution and, with its ease of implementation and strict selection rules, is a convenient technique for verifying molecular integrity and orientation at metal surfaces.
Conditions of work • Rigorous • Base line • Moisture • CO2
Conclusions • IR identifies the components of a sample (liquid, solid or gas). • Infrared (IR) spectrometers measure the interaction of IR radiation with samples. The FTIR spectrometer measures the frequencies at which the samples absorb the radiation, and the intensities of the absorptions. • Intensity and frequency of samples absorption are depicted in a two-dimensional plot called a spectrum. Intensity is generally reported in terms of absorbance - the amount of light absorbed by a sample, or percent transmittance – i.e. the amount of light, which passes through it. • What makes up an unknown sample, and how much of each component is present in that sample, can be valuable information supplied by this technique. Its many applications include research and development of new products.
Sources of informationes • http://www.cem.msu.edu/~parrill/AIRS/ • http://www.wpi.edu/Academics/Depts/Chemistry/Courses/CH2670/infrared.html • http://www.chem.ucla.edu/~webspectra/irintro.html • http://www.spectro.com/pages/e/index.ht