Oxidation-Reduction (Redox) Reactions
530 likes | 829 Vues
Oxidation-Reduction (Redox) Reactions. Measuring voltage. Standard potentials (E°) have been determined for how much voltage ( potential ) a reaction is capable of producing or consuming at standard conditions Nernst Equation. Standard Potentials. Written as reductions.

Oxidation-Reduction (Redox) Reactions
E N D
Presentation Transcript
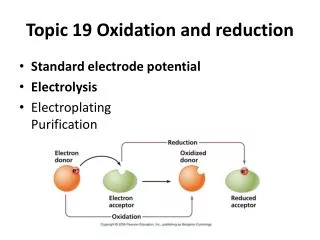
Measuring voltage • Standard potentials (E°) have been determined for how much voltage (potential) a reaction is capable of producing or consuming at standard conditions • Nernst Equation
Standard Potentials Written as reductions Strong Reducing Agents The greater the E°, the more easily the substance reduced Strong Oxidizing Agents
Redox Cell Salt bridge Pt wire electrode H2 gas (1 atm) Fe2+ and Fe3+ [H+] = 1 • H+ + e- ↔ ½ H2(g) • Fe3+ + e- ↔ Fe2+ ←: Pt wire removes electrons from half cell A →: Pt wire provides electrons to the solution
Redox Cell using Platinum • Voltage meter registers difference in potential (E) between the 2 electrodes • Potential of SHE = 0, so E = potential of electrode in half-cell A • Defined as Eh; measured in volts • Eh is positive when [e-] in solution A less than [e-] in SHE • Eh is negative when [e-] in solution A greater than [e-] in SHE
Eh as Master Variable • From electrochemistry: GR = -nF Eh • n = number of electrons • F = Faraday constant = 9.642 x 10⁴ J / V∙mole • By convention, sign of Eh set for half-reaction written with e- on left side of equation • Can calculate E° = -GR° / nF (from Gf° values) • Determine GR° from the way the reaction is written (products – reactants)
Eh as Master Variable • From electrochemistry: GR = -nF Eh • Re-write Nernst Equation: • At 25°C • Oxidized species on side where e- are
Calculating Eh: Example • SO42- + Fe2+ + 8H+ + 8e- FeS + 4H2O
Eh and redox pairs • Redox pair = 2 species of an element with different valences • e.g., SO42- - H2S; Fe3+ - Fe2+ • For every redox pair in a solution, an Eh can be defined • What if a solution has more than one redox pair? • An Eh can be calculated for each pair • All Eh’s will be equal if system at chemical equilibrium • But not so in nature, so different Eh values • Therefore, there is no unique Eh of a solution
Measuring Eh • Eh is typically measured using a platinum (Pt) electrode + reference electrode • The reference electrode is a standard by which the Pt electrode measurement is made against • Ag:AgCl commonly used • Only responds to certain redox pairs • Doesn’t respond to solids • Best response to dissolved metals (e.g. Fe) • Better in reducing waters
Computed vs. Measured Field Eh - Internal equilibrium not achieved - Computed Eh values do not agree with measured - Note vertical bands - Horizontal positions of the vertical bands chiefly reflect the standard E°
Measured vs. Computed Eh - Samples with >1 redox pair - Points connected by vertical line derived from single sample - No internal redox equilibrium Lindberg, R.D. and D.D. Runnells (1984). Ground water redox reactions: an analysis of equilibrium state applied to Eh measurements and geochemical modeling. Science 225(4665):925-927.
Measuring Eh • The Eh value is usually not very accurate in natural waters because of a lack of redoxequilibrium • One half of redox pair often below detection • It does usually give a good general idea of how oxidizing or reducing an environment is • Best to use Eh as a semi-quantitative measurement, giving you a relative idea of the redox potential of the water
Eh – pH Diagrams • A different type of stability diagrams, but using Eh as variable instead of activity • Lines indicate equilibrium • Domains define areas of stability for minerals and aqueous species
Water Stability Limits (H and O) in terms of pH and Eh • H2O(l) 2H+ + ½O2 + 2e- • From thermodynamic data, get: • ΔGR° = 2Gf°(H+) + ½Gf°(O2) + 2Gf°(e-) - Gf°(H2O) • ΔGR° = - Gf°(H2O) = 237.13 kJ/mole • ΔGR° = -nF E° • E° = ΔGR° / nF = 237.13 / [(2)(96.5)] = 1.23 V
Water Stability Limits (H and O) • Eh = 1.23 + 0.0148 log[O2] – 0.059 pH • Establishes relationship among Eh, pH, and fO2 • f = fugacity; basically activity of a gas
Water Stability Limits (H and O) • What are the stability limits of liquid water on Earth? • 2H2O(l) 2H2(g) + O2(g) • ΔGR° = 2 x 237.13 kJ/mole; K = 10-83.1 • At equilibrium, [O2][H2]2 = 10-83.1 • Total pressure of all gases occurring naturally at Earth’s surface must be ≤ 1 atm • If > 1, bubbles form in water exposed to the atmosphere and gases escape • So, fO2 and fH2 must each be ≤ 1 atm for liquid H2O to be stable • So if fH2 is at its maximum (1 atm), [O2] = 10-83.1
Water Stability Limits (H and O) • So, fO2 can vary between 1 – 10-83.1 in equilibrium with H2O(l) at Earth’s surface • Eh = 1.23 + 0.0148 log[O2] – 0.059 pH • For O2 = 1 atm, Eh = 1.23 – 0.059 pH • For O2 = 10-83.1, Eh = 1.23 + 0.0148(-83.1) – 0.059 pH • Eh = 1.23 -1.23 - 0.059 pH • Eh = -0.059 pH
Eh-pH Diagrams • Eh = 1.23 – 0.059 pH (fO2 = 1 atm) • Eh = -0.059 pH(fO2 = 10-83.1atm) • (y = mx + b) • These 2 equations plot as parallel straight lines on an Eh vs. pH plot (same slope) • And for any value of fO2, we would get additional parallel straight lines • Eh = 1.23 + 0.0148 log[O2] – 0.059 pH
O2 and H2 are present in entire H2O stability range Oxidizing and reducing with respect to SHE Oxidizing environments may contain only small amounts of O2
Oxygen • Most common and strongest oxidizing agent at the Earth’s surface is dissolved O2 • Consider pH = 7, Eh = +0.6 V • In groundwater environments, this is very oxidizing • Eh = 1.23 + 0.0148 log[O2] – 0.059 pH • [O2] = 10-14.6atm
Oxidizing environment, but death to fish
Eh-pH Diagrams • Positive Eh = oxidizing environments; tend to function as electron acceptors • Negative Eh = reducing environments; tend to function as electron donors
Stability of Iron Compounds as a function of Eh and pH • Iron (Fe) is a common element on Earth, and is found in many forms and several valence states • Two main valence states are +2 (ferrous) and +3 (ferric); also 0 for native Fe • Solid phases: oxides, oxyhydroxides, sulfides, carbonates, silicates, native • Dissolved: usually Fe2+, Fe3+ in acidic, oxidizing waters • Common nuisance contaminant in groundwater • Important in biochemical processes; essential nutrient
Plotting Fe reactions on Eh-pH Diagram • Select compounds and reactions of interest • Consider solubilities of iron oxide • Hematite (Fe2O3) • 2Fe2+ + 3H2O Fe2O3 + 6H+ + 2e- • (note: by convention, e- always on right side of reactions) • GR = +126.99 kJ/mole • E = +0.66 V • Eh = 0.66 – 0.178 pH – 0.0592 log [Fe2+] • This produces a family of parallel lines (when [Fe2+] is defined expressing solubility of hematite in Eh-pH plane
Solubility increases with decreasing pH and Eh; i.e., hematite dissolved under these conditions • [Fe2+] = 10-8 • [Fe2+] = 10-4 • [Fe2+] = 10-6
Plotting Fe reactions on an Eh-pH Diagram • Next, magnetite (Fe3O4) and Fe2+ • 3Fe2+ + 4H2O Fe3O4 + 8H+ + 2e- • GR = +169.82 kJ/mole • E = +0.88 V • Eh = 0.88 – 0.237 pH – 0.089 log [Fe2+]
10-4 • [Fe2+] = 10-6 10-8
Equilibria between Fe2+ and 2 minerals How do we determine where each mineral dominates?
Plotting Fe reactions on Eh-pH Diagram • Need to consider equilibrium between magnetite and hematite • 2 Fe3O4+ H2O 3Fe2O3 + 2H+ + 2e- • GR = +41.33 kJ/mole • E = +0.21 V • Eh = 0.21 – 0.0592 pH • [Fe2+] not a variable, don’t have to define its activity
Plotting Fe reactions on Eh-pH Diagram • Iron can also be Fe3+ in solution • Consider relationship between Fe2+ and Fe3+ • Fe2+ Fe3+ + e- • Eh = 0.77 V; independent of pH • Constant Eh, horizontal line
Plotting Fe reactions on Eh-pH Diagram • Iron can also be Fe3+ in solution • Fe2O3 + 6H+ 2Fe3+ + 3H2O • log [Fe3+] + 3 pH = -1.88 • Independent of Eh because no change in valence state (Fe in hematite is Fe3+ as well) • Constant pH, vertical line • Fe3O4 + 8H+ 3Fe3+ + 4H2O + e- • Eh = -0.55 + 0.473 pH
Plotting Fe reactions on Eh-pH Diagram • Now let’s consider an iron carbonate mineral, siderite (FeCO3) • Fe is in the Fe2+ state (reduced); more common in subsurface • 3FeCO3 + H2O Fe3O4 + 3CO2 + 2H+ + 2e- • Eh = 0.265 – 0.0592 pH + 0.0887 log [CO2] • At atmospheric PCO2 (3 x 10⁻⁴): • Eh = -0.048 – 0.0592 pH • Siderite-magnetite line plots below H2O stability limit • Thus siderite can’t precipitate unless PCO2 > atmospheric
Plotting Fe reactions on Eh-pH Diagram • FeCO3 + 2H+ Fe2+ + CO2 + H2O • K = ([CO2] [Fe2+]) / [H+]2 • 2pH = 6.958 – log [CO2] - log[Fe2+] • Note: it is independent of Eh (no e- transfer), so if we set [CO2] and [Fe2+], it’s a vertical line • For [CO2] = 10-2 and [Fe2+] = 10-6 mol/L, pH = 7.48
Source of dissolved species • Primarily from chemical weathering • Primary minerals + acid secondary minerals + dissolved ions • The essential ingredients needed to produce chemical weathering are water and acid • Water sources: start with precipitation
Chemical composition of precipitation (snow and rain) • Low TDS: ≤ 15 mg/L (water in contact with “rocks” for short period) • Acidic pH 5-6 naturally, in industrial area pH 3-4 (acid rain) • Dissolved ion composition variable, dependent on regional dust composition • e.g., in coastal areas Na+ and Cl- dominate (marine aerosols) • Regional limestones: Ca2+ and HCO3- dominate • Others: SO42- or NO3- can dominate • Also has dissolved gases: CO2 and O2 most important
Soils • In most areas, soils are the first geologic unit to come into contact with precipitation • Soils have the highest rate of chemical weathering • Soil CO2 increases due to decay of organic matter • When water reaches water table, TDS has usually increased by more than 10x • Complex interactions involving geologic materials (rocks or sediments), water, plants, animals, microorganisms, gases • Role of biology is key: produce acids (CO2 and organic), decay of organics, affect soil structure, bioturbation
Soil reactions • Throughout soil column: • CO2 produced by decay of organics and plant respiration • O2 consumed by decay of organics and redox reactions (Fe and S minerals) • N cycling • Soils continually produce acid (carbonic and organic)
Soils and acidity • Soil CO2 is 10 – 100 X greater than in atmosphere, thus 10 – 100 X greater acidity • CO2 + H2O H2CO3 H+ + HCO3- • Carbonic acid does most weathering • Organic acids: accounts for some weathering; also complexation with inorganic ions • Can affect solute transport mechanisms
Plants/Animals • Plants take up and release inorganic elements as nutrients • Seasonal affects • On a seasonal basis, element uptake does not equal its release • But on an annual basis, uptake approximately equals release • Over decadal-century time frame, uptake approximately equals release (steady state) • No steady state if crops are harvested; this is why fertilizers must be added
Generalized nutrient requirements of plants (molar) • 800 CO2 • 6 NH4+ • 4 Ca2+ • 1 Mg2+ • 2 K+ • 1 Al(OH)2+ • 1 Fe2+ • 2 NO3- • 1 H2PO4- • 1 SO42- • H2O • Micronutrients: B, Cu, Mn, Mo, Zn, Cl- • Na+ only major ion not involved in biological activity